Why I still run Qwen3.5-27B on 4x3090 despite faster MoEs
tldr
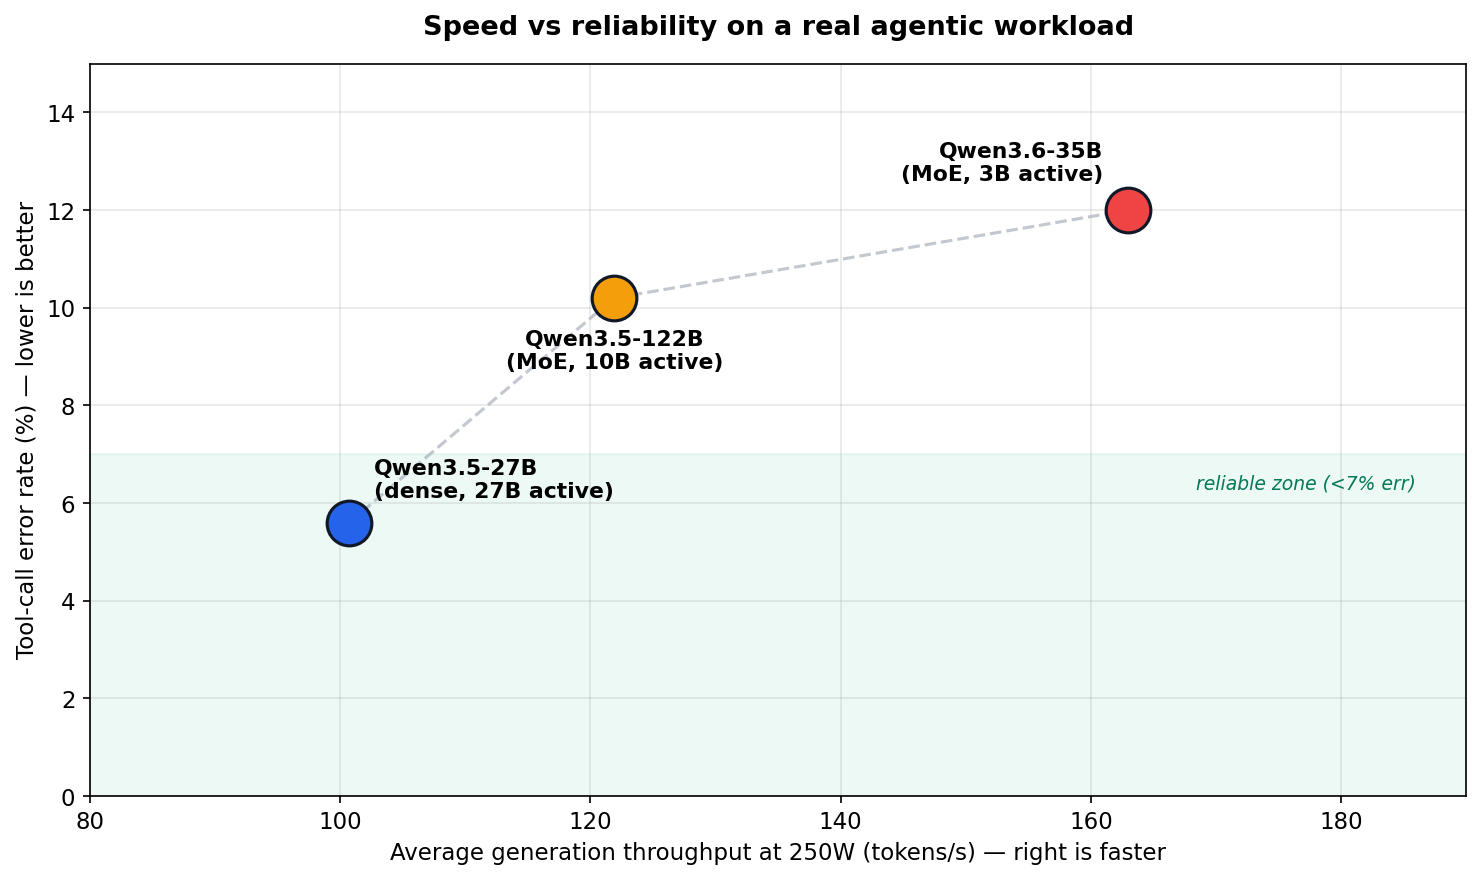
The fastest model on this box is not the best agent model on this workload. Qwen3.6-35B wins on generation speed, Qwen3.5-122B wins on prefill per watt, but the dense Qwen3.5-27B is still the best overall because it makes about half the tool-call errors and recovers better when blocked.
- Run Qwen3.5-27B dense in INT8 with MTP speculative decoding and FP8 KV cache. Pin the cards at 250W. Keep concurrency at 1-3 if you care about per-agent latency. 5.6% tool error rate, lowest of all three.
- The 122B MoE is faster at prefill per watt but less reliable at tool calls under AWQ-INT4 with FP8 KV cache. 10.2% error rate. Good for batch jobs that do not rely on sequential consistency.
- Qwen3.6-35B-A3B is the speed king (2-3x faster generation than the 27B, holds up at high concurrency) and probably great for coding agents. Runs FP16 KV cache, no FP8. For my structured non-coding agentic workload it has the worst error rate at 12.0%, mostly from shell habits that violate the allow list. Both MoE models struggle with following permissions and instructions compared to the dense 27B.
- Both MoE models are prone to crashing under heavy load where the dense 27B is impervious. Lowering
--gpu-memory-utilizationto leave more free space for dynamically allocated memory helps but does not fully fix it. - Why the MoEs break rules differently from the dense has a post of its own: MoE routing: global rules lose to learned heuristics. Short version: routing caps reliability at a rough ceiling across very different MoE configs; post-training only changes which kinds of errors the model makes, not how many.
One important scope note. All reliability numbers here come from one harness — a tight-allow-list orchestrator with ~150 subagents calling tools via bash. On a looser harness that permits the shell idioms MoEs reach for, the ordering would look different, especially for the 3.6-35B (which was tuned for exactly that looser style).
The stage
I have 4x RTX 3090, two of them NVLinked and one of them a 3090 Ti. All are undervolted, usually pinned at 175W as the sweet spot. The Ti has a slightly higher stock TDP but here it’s treated as another regular 3090, so the 256 extra cuda cores don’t make much difference. The system also has one sad Nvidia A4000 that acts as a dumping ground for all the unloved and unwanted models I may need running alongside the main one: Whisper, maybe some TTS, maybe a ComfyUI instance, but it’s mostly an accessory to the main system.
Additionally I have a Strix Halo box (Bosgame M5, 128 GB of 8000 MHz RAM) which is mostly useful for hosting smaller fine-tuned models, uncensored MoE models in MXFP4, or ComfyUI with VRAM-hungry workloads for video, image, and 3D generation.
Finding the current meta
Every new open-weights drop could shift the local-hosting meta. For a long time the quality king at this size was glm-4.5-air. Some may say it was gpt-oss-120b — they were wrong, unless the goal was to generate a loooot of tokens very fast. Qwen’s 3.5 and 3.6 lines are what actually moved the meta.
Autonomous agentic use case
My main use case is a multi-agent system that works somewhat similar to OpenClaw, but was built before crab fever consumed everything and runs on OpenCode agents compiled with a custom framework (OpenAgentCompiler — design choices written up separately). It is basically a stack of orchestrator agents layered several levels deep. Because of that I can use even very weak local models without worrying that access to thousands of tools would overwhelm the agent. The current system is composed of 150+ subagents that route tasks to each other while calling tools via bash. This architecture promotes economical intelligence: I do not need one slow, extremely large model contorted through quantization to fit into 96 GB of VRAM. On the other hand, decomposing every task into extremely small and simple steps would be counterproductive. I need something that can handle complex tasks without forcing me to hardcode each agentic path explicitly.
On matched workloads the dense 27B made 5.6% tool-call errors against 10.2% for the 122B MoE and 12.0% for the 3.6-35B MoE. The rest of the post is really about why that gap matters more than the speed charts suggest.
The winning Qwen3.5-27B config
Qwen3.5-27B with MTP speculative decoding and FP8 KV-cache quantization peaks around 4800 tokens/s prefill and ~277 t/s generation on 4 GPUs. Under concurrent load at 250W that settles to ~963 prefill and ~88 generation. The peaks are best-case numbers, not the steady state. Generation speed depends heavily on power and concurrency, which is what most of this post is about.
A few things in the yml are worth calling out. NVIDIA_VISIBLE_DEVICES=0,2,3,4 skips index 1 on purpose, since that slot is the A4000. --disable-custom-all-reduce was added for stability as vLLM was hanging trying to decipher topology of 2 nvlinked RTX 3090 + 2 PCI only RTX’es.
name: vllm-thinking

services:
  vllm:
    image: vllm/vllm-openai:v0.19.0
    restart: unless-stopped
    runtime: nvidia
    shm_size: 8gb
    ipc: host
    environment:
      - NVIDIA_VISIBLE_DEVICES=0,2,3,4
      - CUDA_DEVICE_ORDER=PCI_BUS_ID
      - RAY_memory_monitor_refresh_ms=0
      - NCCL_CUMEM_ENABLE=0
      - NCCL_NVLINK_DISABLE=0
      - VLLM_ENABLE_CUDAGRAPH_GC=1
      - VLLM_USE_FLASHINFER_SAMPLER=1
      - PYTORCH_ALLOC_CONF=expandable_segments:True
    volumes:
      - "/mnt/ssd-4tb/ai_models/models/hub:/root/.cache/huggingface/hub"
    ports:
      - "8082:8000"
    command: >
      --model cyankiwi/Qwen3.5-27B-AWQ-BF16-INT8
      --served-model-name cyankiwi/Qwen3.5-27B-AWQ-BF16-INT8
      --quantization compressed-tensors
      --port 8000
      --host 0.0.0.0
      --tensor-parallel-size 4
      -O3
      --max-model-len 262144
      --gpu-memory-utilization 0.9
      --dtype auto
      --enable-auto-tool-choice
      --tool-call-parser qwen3_coder
      --reasoning-parser qwen3
      --limit-mm-per-prompt '{"image":10,"video":2}'
      --enable-prefix-caching
      --disable-custom-all-reduce
      --kv-cache-dtype fp8
      --max-num-seqs 12
      --max-num-batched-tokens 8192
      --compilation-config '{"cudagraph_capture_sizes":[1,2,4,8,12]}'
      --trust-remote-code
      --no-use-tqdm-on-load
      --generation-config auto
      --attention-backend FLASHINFER
      --speculative-config '{"method":"qwen3_next_mtp","num_speculative_tokens":2}'
      --override-generation-config '{"temperature":1.0,"top_p":0.95,"top_k":20,"min_p":0.0,"presence_penalty":1.5,"repetition_penalty":1.0}'

    healthcheck:
      test: ["CMD", "curl", "-f", "http://localhost:8000/health"]
      interval: 30s
      timeout: 10s
      retries: 3
      start_period: 300s
The -O3 tradeoff
-O3 costs more VRAM upfront and extends the coldstart but gives back better throughput, mostly on prefill but also on generation. By default it captures cudagraphs up to 128, which is throughput I could only dream about, so I use --compilation-config '{"cudagraph_capture_sizes":[1,2,4,8,12]}' to match my --max-num-seqs 12.
Sampling settings
The --override-generation-config line in the yml sets temperature 1.0, top_p 0.95, top_k 20, presence_penalty 1.5, repetition_penalty 1.0. It’s configured for the general thinking tasks preset instead of coding with thinking as it was more reliable than the coding version for my particular agentic setup. E.g. on the coding preset agents were much more likely to loop or start repeating the same action, and the problem was worse on MoE models.
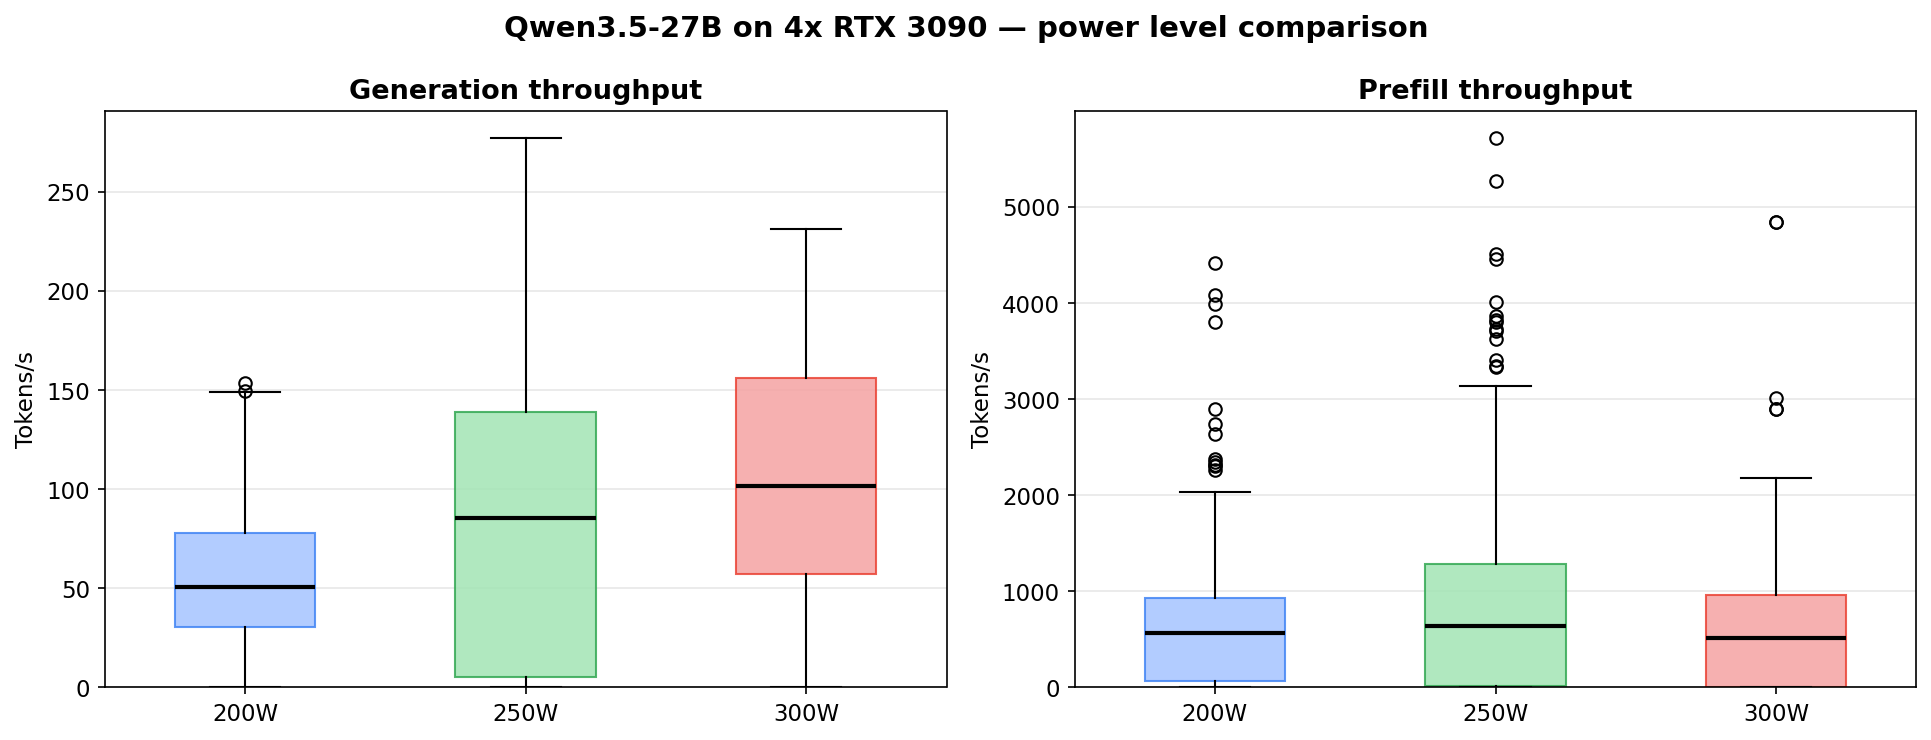
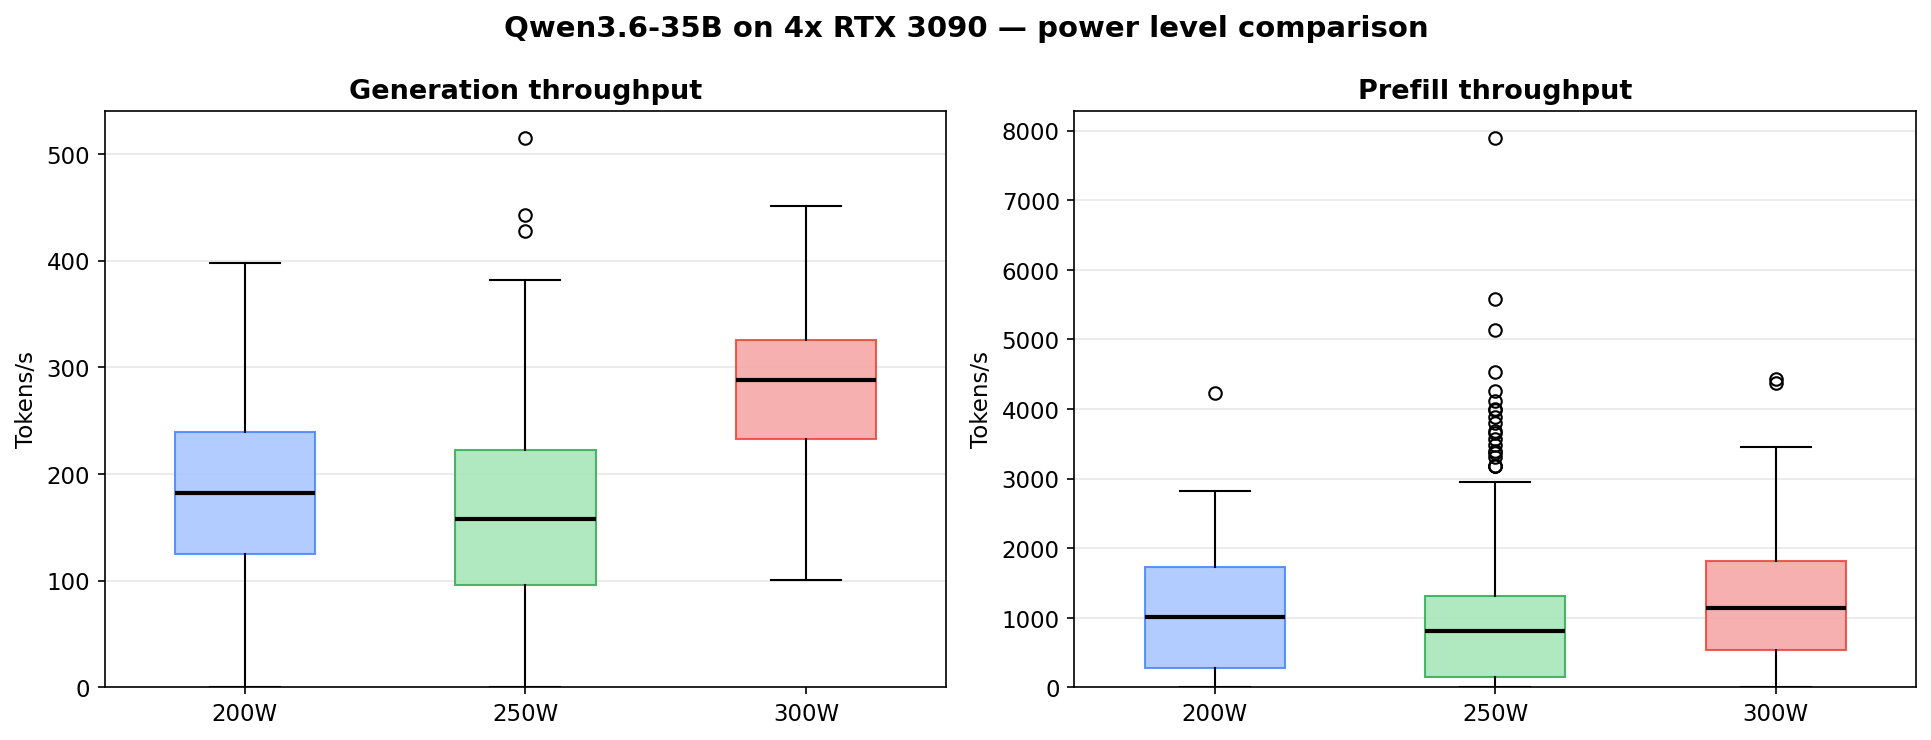
Power vs performance
Tested at three power limits: 200W, 250W and 300W. And based on that sweet spot seems to be around 250W for this particular workload.
| Power | Samples | Avg Gen (t/s) | Median Gen | P95 Gen | Avg Prefill (t/s) | Median Prefill |
|---|---|---|---|---|---|---|
| 200W | 156 | 56.5 | 52.5 | 129.5 | 929.1 | 655.1 |
| 250W | 141 | 100.7 | 101.2 | 214.7 | 1025.6 | 642.2 |
| 300W | 69 | 106.6 | 102.5 | 210.7 | 1008.1 | 670.6 |
250W roughly doubles generation throughput over 200W (about 1.8x). 300W barely moves the needle for 20% more power draw.
Generation by concurrency
Data from a real agentic workload. It’s the result of parsing vLLM logs while the system was running under varied load. Not as clean as a synthetic benchmark, but it actually shows how well the system handles large agentic tasks with input prompts ranging between 30-60k tokens. A few cells still have only 2 to 7 samples, so treat those as directional rather than definitive. Even for the low-sample cells the trend holds.
How the data is collected. vLLM’s engine emits Avg prompt throughput (prefill), Avg generation throughput, and Running: N reqs once every 10 seconds. I parsed those log lines and bucketed each sample by the Running count. Every cell in the concurrency tables below is the arithmetic mean of the 10-second windows that landed at that concurrency level during the measurement period — so a Samples value of 6 means roughly 60 seconds of wall time during which exactly that many requests were in flight. No synthetic scripts, no controlled request rates; whatever the orchestrator happened to be doing is what got measured, and Samples is how long each concurrency level was observed for.
| Power limit | Concurrent reqs | Samples | Avg gen t/s | Median gen t/s | Peak gen t/s | Per-request t/s |
|---|---|---|---|---|---|---|
| 200W | 1 | 90 | 53 | 49 | 107 | 53 |
| 200W | 2 | 37 | 76 | 71 | 153 | 38 |
| 200W | 3 | 6 | 56 | 74 | 93 | 19 |
| 200W | 4 | 11 | 52 | 54 | 149 | 13 |
| 200W | 5 | 5 | 23 | 20 | 53 | 5 |
| 200W | 6 | 7 | 26 | 2 | 99 | 4 |
| 250W | 1 | 8 | 85 | 81 | 119 | 85 |
| 250W | 2 | 28 | 97 | 96 | 214 | 49 |
| 250W | 3 | 36 | 133 | 128 | 245 | 44 |
| 250W | 4 | 19 | 112 | 108 | 277 | 28 |
| 250W | 5 | 34 | 68 | 47 | 238 | 14 |
| 250W | 6 | 16 | 98 | 107 | 220 | 16 |
| 300W | 1 | 8 | 65 | 83 | 127 | 65 |
| 300W | 2 | 21 | 113 | 103 | 218 | 57 |
| 300W | 3 | 15 | 148 | 167 | 211 | 49 |
| 300W | 4 | 11 | 118 | 132 | 231 | 30 |
| 300W | 5 | 12 | 73 | 65 | 202 | 15 |
| 300W | 6 | 2 | 28 | 28 | 53 | 5 |
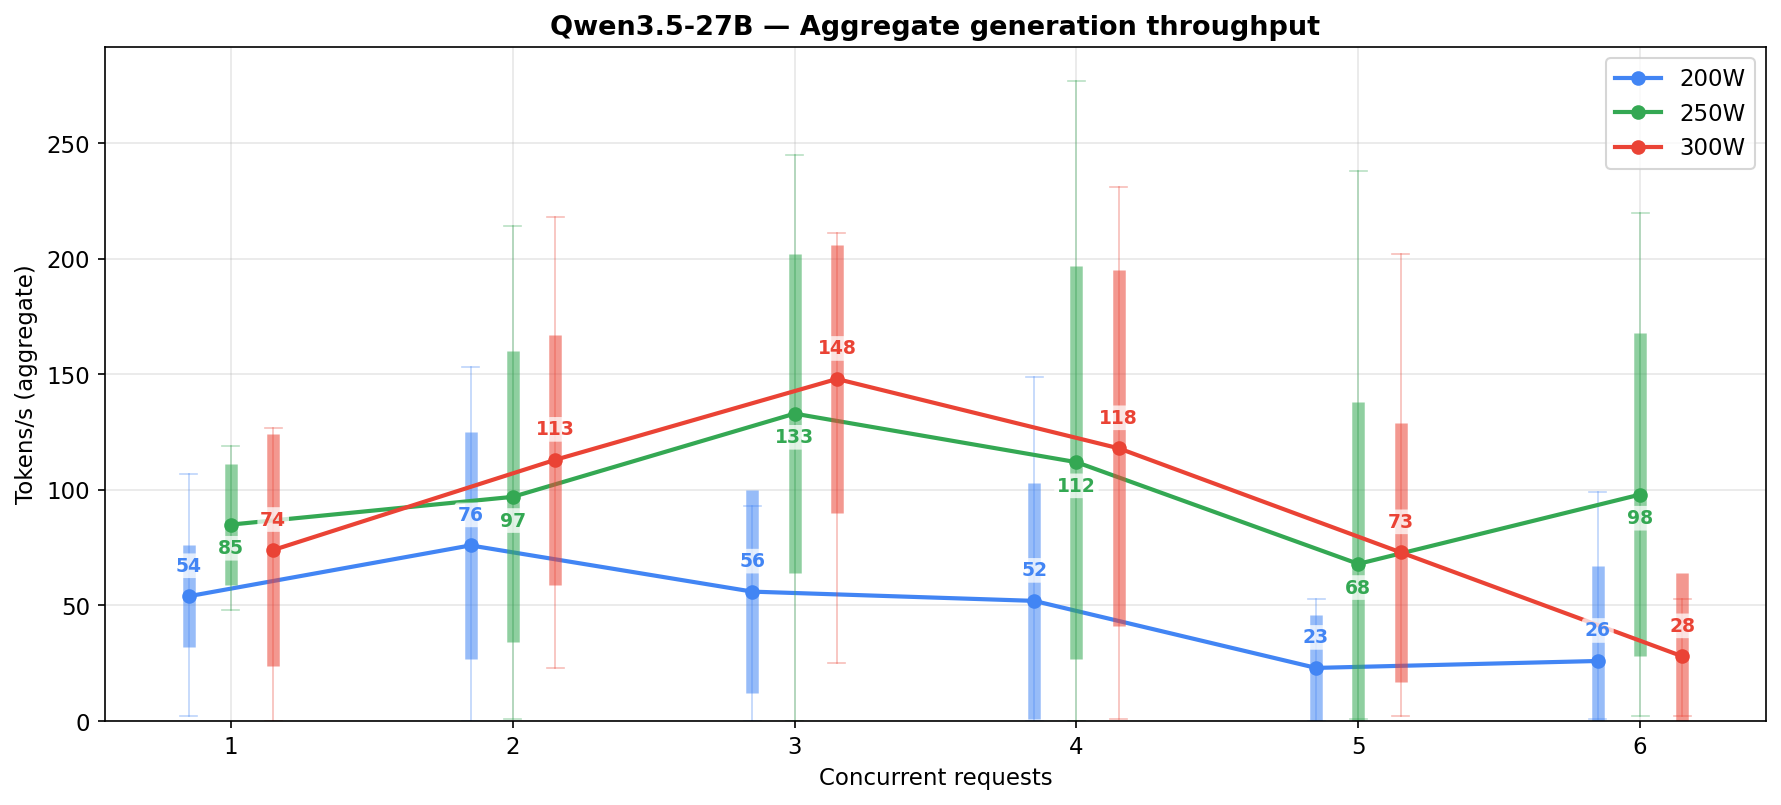
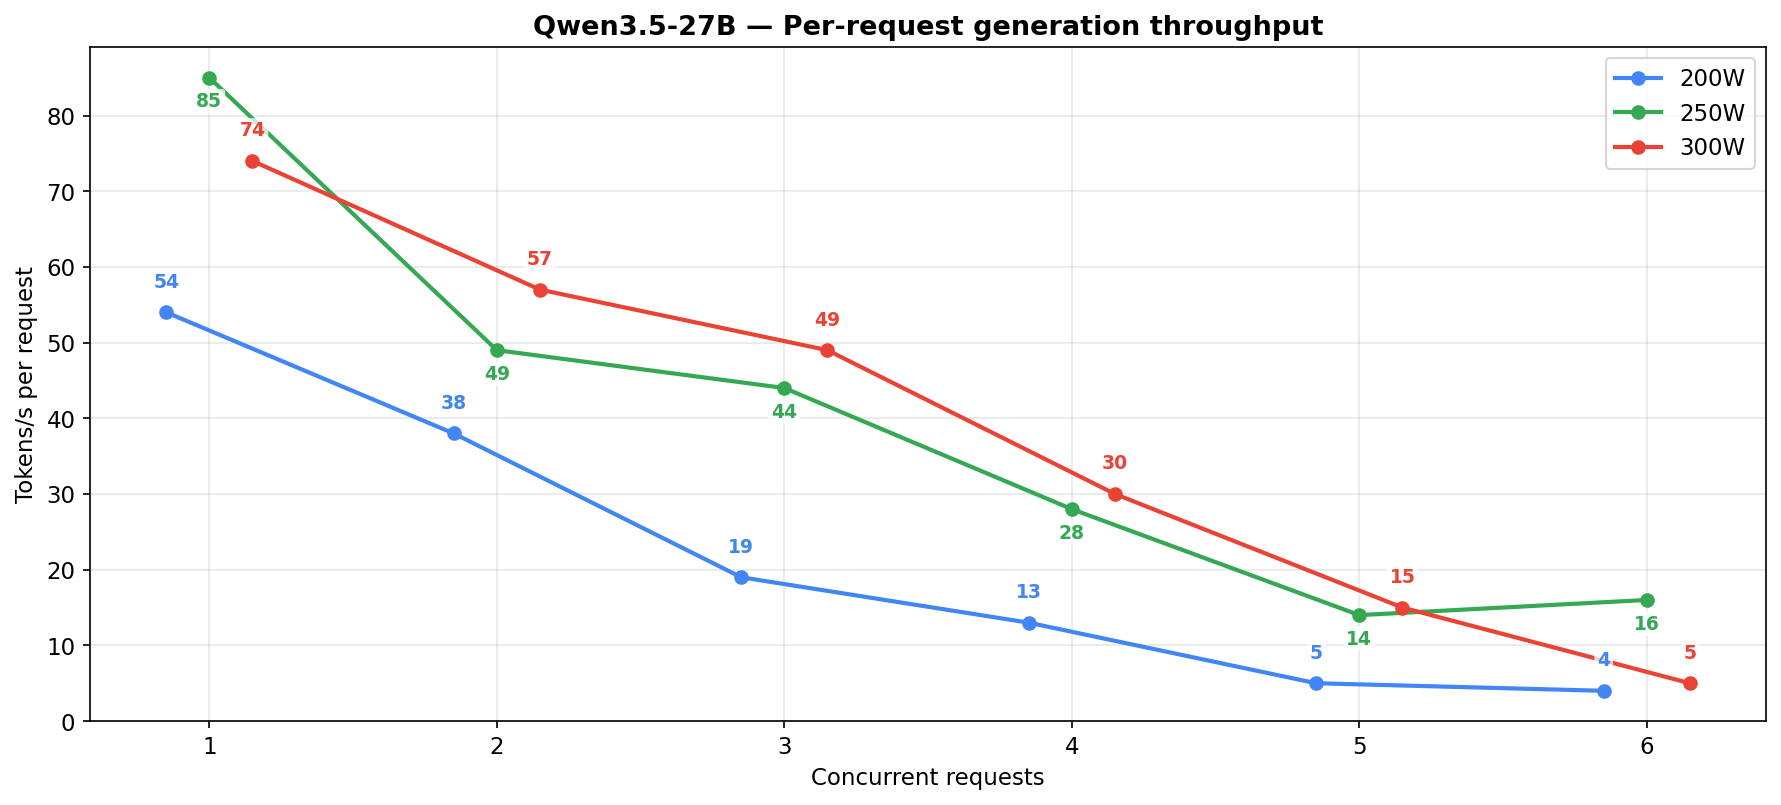
Per-request generation dies past 2-3 concurrent regardless of power level. If you care about how fast each agent gets its response (and you should), keep it to 1-3 concurrent at 250W.
What about TP=2 on the NVLinked pair?
On paper the 27B at INT8 fits on two 3090s. In practice INT8 weights + KV cache + MTP + 262144 context does not fit on 2x 24GB. You have to drop to Q4, which loses quality and shrinks usable context. TP=2 on the NVLinked pair is more useful for hosting e.g. a Heretic (uncensored) 27B that does not benefit from MTP alongside a smaller model on the other two cards.
What about Qwen3.5-35B-A3B?
Tried it. Same family as the 3.6-35B-A3B released later (35B total, 3B active, MoE). Fast for chat and short coding tasks. On complex agentic workloads at large context it falls into repetition loops and does not recover without a restart. Tried it at FP16 and at Q8 with FP16 KV cache, the problems persisted.
The MoE alternative: Qwen3.5-122B-A10B
The 122B MoE activates only 10B parameters per forward pass, less than the 27B dense, and fits in the same VRAM budget at AWQ-INT4. Peaks at ~7700 tokens/s prefill (~60% faster than the 27B). Under concurrent load the prefill advantage holds at roughly 2x at 250W and 300W, and closer to 3x at 200W. Generation is competitive with the 27B at 200W (59 vs 56 t/s aggregate) but the 27B pulls ahead at higher power levels (101 vs 84 t/s at 250W, 107 vs 98 t/s at 300W) — the 122B’s routing overhead shows up more as power goes up.
MoEs are tricky. On benchmarks the 122B scores marginally better than the dense 27B, but those benchmarks compare full-precision models — here I’m forced to run the MoE in Q4. MoEs are more sensitive to quantization and partial KV precision, so in practice we lose whatever small margin the 122B has over the 27B at full precision.
Quantization tradeoffs
The 27B dense at INT8 (AWQ-BF16-INT8) just works. Quality is great, it is possible to run long context RALF that is actually able to finish the task, MTP speculative decoding works stable when set to 1 or 2 speculative tokens (more is starting causing random crashes). The 122B MoE at AWQ-INT4 is where things get messy: garbled tool calls and broken JSON that never happened on the dense model.
I tried swapping FP8 KV cache for full FP16 KV to see if that would fix tool-call behavior. It is expensive: FP16 KV is 2x the size so max-num-seqs drops to 2-4, there is no way to use it with -O3, and FlashInfer gets swapped for FlashAttention2. Output quality was not meaningfully better. The model still fell into generation loops. The Q4 weight quantization, not KV cache precision, is the real ceiling on this hardware budget. A higher-precision quant of the 122B that fits in 96 GB would probably handle it better, but that would mean leaving the nicely optimized AWQ quants for the wild west of GGUF integrations with vLLM, or switching inference engine to llama.cpp or Ollama.
The config
name: vllm-thinking

services:
  vllm:
    image: vllm/vllm-openai:v0.19.0
    restart: unless-stopped
    runtime: nvidia
    shm_size: 8gb
    ipc: host
    environment:
      - NVIDIA_VISIBLE_DEVICES=0,2,3,4
      - CUDA_DEVICE_ORDER=PCI_BUS_ID
      - RAY_memory_monitor_refresh_ms=0
      - NCCL_CUMEM_ENABLE=0
      - NCCL_NVLINK_DISABLE=0
      - VLLM_ENABLE_CUDAGRAPH_GC=1
      - VLLM_USE_FLASHINFER_SAMPLER=1
      - PYTORCH_ALLOC_CONF=expandable_segments:True
    volumes:
      - "/mnt/ssd-4tb/ai_models/models/hub:/root/.cache/huggingface/hub"
    ports:
      - "8082:8000"
    command: >
      --model QuantTrio/Qwen3.5-122B-A10B-AWQ
      --served-model-name QuantTrio/Qwen3.5-122B-A10B-AWQ
      --port 8000
      --host 0.0.0.0
      --tensor-parallel-size 4
      --enable-expert-parallel
      -O3
      --max-model-len 262144
      --gpu-memory-utilization 0.94
      --kv-cache-dtype fp8
      --dtype auto
      --enable-auto-tool-choice
      --tool-call-parser qwen3_coder
      --reasoning-parser qwen3
      --limit-mm-per-prompt '{"image":10,"video":2}'
      --enable-prefix-caching
      --disable-custom-all-reduce
      --max-num-seqs 8
      --max-num-batched-tokens 8192
      --compilation-config '{"cudagraph_capture_sizes":[1,2,4,8]}'
      --trust-remote-code
      --quantization awq_marlin
      --attention-backend FLASHINFER
      --no-use-tqdm-on-load
      --generation-config auto
      --override-generation-config '{"temperature":1.0,"top_p":0.95,"top_k":20,"min_p":0.0,"presence_penalty":1.5,"repetition_penalty":1.0}'

    healthcheck:
      test: ["CMD", "curl", "-f", "http://localhost:8000/health"]
      interval: 30s
      timeout: 10s
      retries: 3
      start_period: 600s
Why --max-num-seqs is 8
With -O3 on, vLLM captures CUDA graphs for each batch size in cudagraph_capture_sizes. 8 is the largest value that fits across 4x 24GB without OOMing during startup with AWQ-INT4 weights, FP8 KV cache, and 262144 context. The 27B gets to 12 because INT8 weights leave more headroom. Does not matter much in practice, per-request throughput on long prompts collapses past 3-4 concurrent anyway. But it is nice to have it set higher to handle an influx of small tool-call requests or short external calls.
122B power vs performance
| Power | Samples | Avg Gen (t/s) | Median Gen | P95 Gen | Avg Prefill (t/s) | Median Prefill |
|---|---|---|---|---|---|---|
| 200W | 137 | 59.1 | 44.9 | 177.0 | 2838.2 | 2761.4 |
| 250W | 87 | 84.0 | 70.8 | 254.1 | 2154.6 | 1571.0 |
| 300W | 80 | 97.8 | 99.4 | 208.4 | 2132.5 | 1300.5 |
Prefill is roughly 2x faster than the 27B. Generation scales monotonically with power (59 → 84 → 98 t/s) — at matched low concurrency (c=1-4) the 200W numbers are actually competitive with 250W, but the 200W column’s aggregate gets pulled down by the heavy high-concurrency tail (c=6-8 account for 58% of its samples and those cells collapse to ~20-26 t/s). Prefill moves the other way — the 200W column is the highest on aggregate. Not really sure why.
122B generation by concurrency
| Power limit | Concurrent reqs | Samples | Avg gen t/s | Median gen t/s | Peak gen t/s | Per-request t/s |
|---|---|---|---|---|---|---|
| 200W | 1 | 16 | 84 | 86 | 122 | 84 |
| 200W | 2 | 13 | 105 | 107 | 169 | 52 |
| 200W | 3 | 10 | 140 | 171 | 204 | 47 |
| 200W | 4 | 12 | 129 | 134 | 231 | 32 |
| 200W | 5 | 7 | 76 | 52 | 147 | 15 |
| 200W | 6 | 15 | 21 | 3 | 89 | 4 |
| 250W | 1 | 21 | 74 | 83 | 164 | 74 |
| 250W | 2 | 13 | 48 | 50 | 157 | 24 |
| 250W | 3 | 9 | 111 | 127 | 186 | 37 |
| 250W | 4 | 9 | 123 | 103 | 278 | 31 |
| 250W | 5 | 17 | 138 | 127 | 283 | 28 |
| 250W | 6 | 3 | 33 | 33 | 63 | 5 |
| 300W | 1 | 17 | 91 | 95 | 157 | 91 |
| 300W | 2 | 22 | 118 | 130 | 234 | 59 |
| 300W | 3 | 16 | 126 | 116 | 218 | 42 |
| 300W | 4 | 8 | 78 | 99 | 141 | 19 |
| 300W | 5 | 7 | 87 | 98 | 189 | 17 |
| 300W | 6 | 6 | 57 | 64 | 103 | 9 |
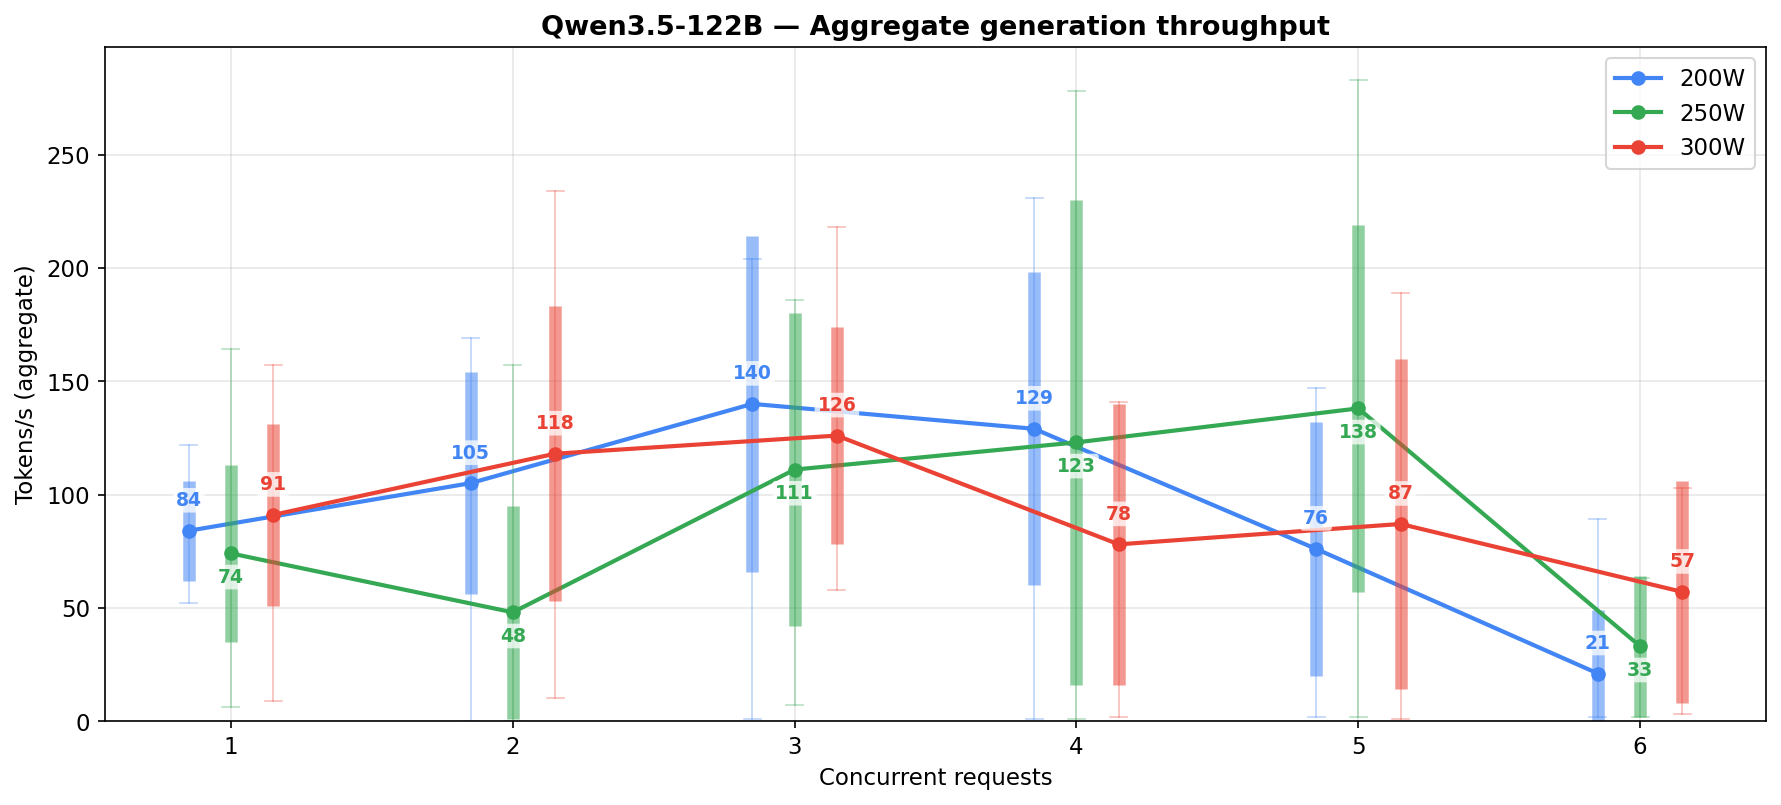
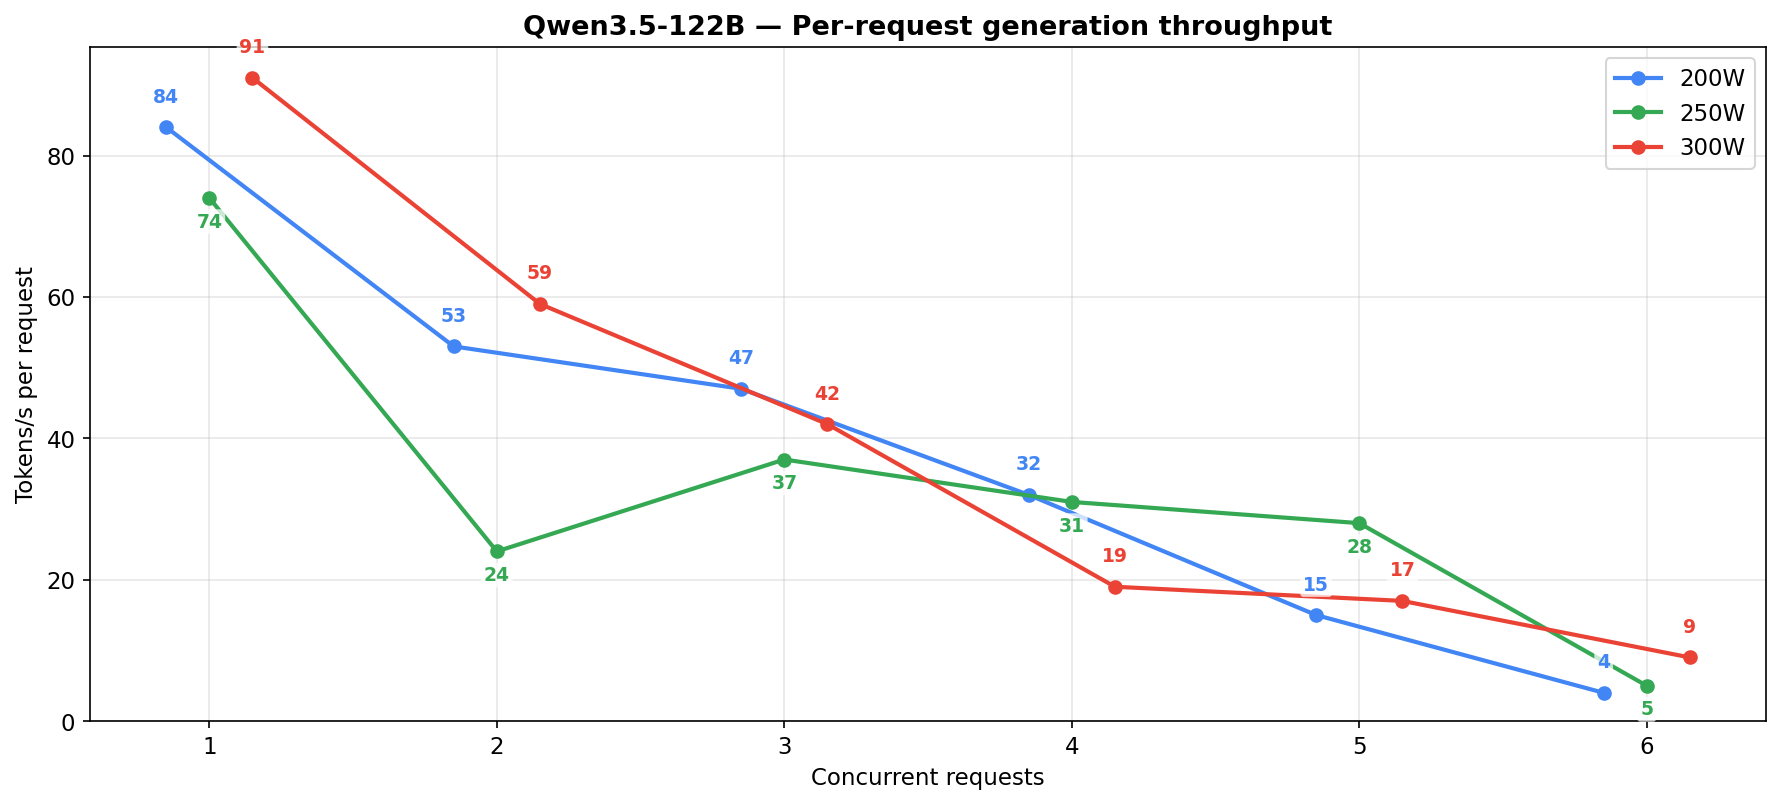
Each column shows a different shape. At 200W the low-concurrency cells (c=1-4) look healthy at n=10-16 per cell with avg 84-140 t/s, but the high-concurrency tail (c=6 at n=15, avg 21 t/s) drags the aggregate down. 250W peaks in the c=3-5 middle then crashes at c=6. 300W is more monotonic but runs out of low-concurrency samples past c=4. Even where sample counts are healthy, the 122B’s noise floor stays wider than the 27B’s — MoE routing makes every run land somewhere different, where the 27B’s numbers are tight and repeatable.
The new contender: Qwen3.6-35B
After the Qwen3.5 testing was done, Qwen3.6-35B dropped. Not dense though, it is a MoE with 35B total and 3B active parameters. Fits in the same VRAM budget as the 27B. Generation throughput blows both previous models out of the water.
The config
name: vllm-thinking

services:
  vllm:
    image: vllm/vllm-openai:v0.19.0
    restart: unless-stopped
    runtime: nvidia
    shm_size: 8gb
    ipc: host
    environment:
      - NVIDIA_VISIBLE_DEVICES=0,2,3,4
      - CUDA_DEVICE_ORDER=PCI_BUS_ID
      - RAY_memory_monitor_refresh_ms=0
      - NCCL_CUMEM_ENABLE=0
      - NCCL_NVLINK_DISABLE=0
      - VLLM_ENABLE_CUDAGRAPH_GC=1
      - VLLM_USE_FLASHINFER_SAMPLER=1
      - PYTORCH_ALLOC_CONF=expandable_segments:True
    volumes:
      - "/mnt/ssd-4tb/ai_models/models/hub:/root/.cache/huggingface/hub"
    ports:
      - "8082:8000"
    command: >
      --model Qwen/Qwen3.6-35B-A3B-FP8
      --served-model-name Qwen/Qwen3.6-35B-A3B-FP8
      --port 8000
      --host 0.0.0.0
      --tensor-parallel-size 4
      --enable-expert-parallel
      -O3
      --max-model-len 262144
      --gpu-memory-utilization 0.94
      --dtype auto
      --enable-auto-tool-choice
      --tool-call-parser qwen3_coder
      --reasoning-parser qwen3
      --limit-mm-per-prompt '{"image":10,"video":2}'
      --enable-prefix-caching
      --disable-custom-all-reduce
      --max-num-seqs 8
      --max-num-batched-tokens 8192
      --compilation-config '{"cudagraph_capture_sizes":[1,2,4,8]}'
      --trust-remote-code
      --no-use-tqdm-on-load
      --attention-backend FLASHINFER
      --generation-config auto
      --override-generation-config '{"temperature":1.0,"top_p":0.95,"top_k":20,"min_p":0.0,"presence_penalty":1.5,"repetition_penalty":1.0}'

    healthcheck:
      test: ["CMD", "curl", "-f", "http://localhost:8000/health"]
      interval: 30s
      timeout: 10s
      retries: 3
      start_period: 300s
Two MoE-specific notes: --enable-expert-parallel same as the 122B since this is also MoE, and FP8 KV cache is not set (3.6-35B-A3B is unstable with FP8 KV, runs on default FP16 KV instead).
3.6-35B power vs performance
| Power | Samples | Avg Gen (t/s) | Median Gen | P95 Gen | Avg Prefill (t/s) | Median Prefill |
|---|---|---|---|---|---|---|
| 200W | 40 | 188.4 | 181.5 | 330.0 | 1119.8 | 1015.5 |
| 250W | 157 | 163.0 | 158.0 | 353.0 | 1123.8 | 807.0 |
| 300W | 64 | 284.1 | 288.0 | 389.0 | 1268.2 | 1135.5 |
Unlike the 27B where 300W barely moved the needle, the 3.6-35B actually scales with power. 300W gives 74% more generation than 250W. Prefill sits between the 27B and 122B, nothing special there.
3.6-35B generation by concurrency
| Power limit | Concurrent reqs | Samples | Avg gen t/s | Median gen t/s | Peak gen t/s | Per-request t/s |
|---|---|---|---|---|---|---|
| 200W | 1 | 13 | 133 | 133 | 197 | 133 |
| 200W | 2 | 14 | 187 | 184 | 370 | 93 |
| 200W | 3 | 8 | 228 | 229 | 330 | 76 |
| 200W | 4 | 4 | 278 | 268 | 398 | 69 |
| 200W | 5 | 1 | 236 | 236 | 236 | 47 |
| 250W | 1 | 90 | 122 | 135 | 250 | 122 |
| 250W | 2 | 34 | 174 | 191 | 278 | 87 |
| 250W | 3 | 16 | 215 | 224 | 330 | 71 |
| 250W | 4 | 8 | 288 | 336 | 427 | 72 |
| 250W | 5 | 4 | 348 | 359 | 514 | 69 |
| 250W | 6 | 5 | 296 | 360 | 442 | 49 |
| 300W | 1 | 2 | 204 | 204 | 217 | 204 |
| 300W | 2 | 9 | 236 | 243 | 325 | 118 |
| 300W | 3 | 22 | 286 | 284 | 383 | 95 |
| 300W | 4 | 23 | 304 | 303 | 451 | 76 |
| 300W | 5 | 7 | 286 | 276 | 429 | 57 |
| 300W | 6 | 1 | 349 | 349 | 349 | 58 |
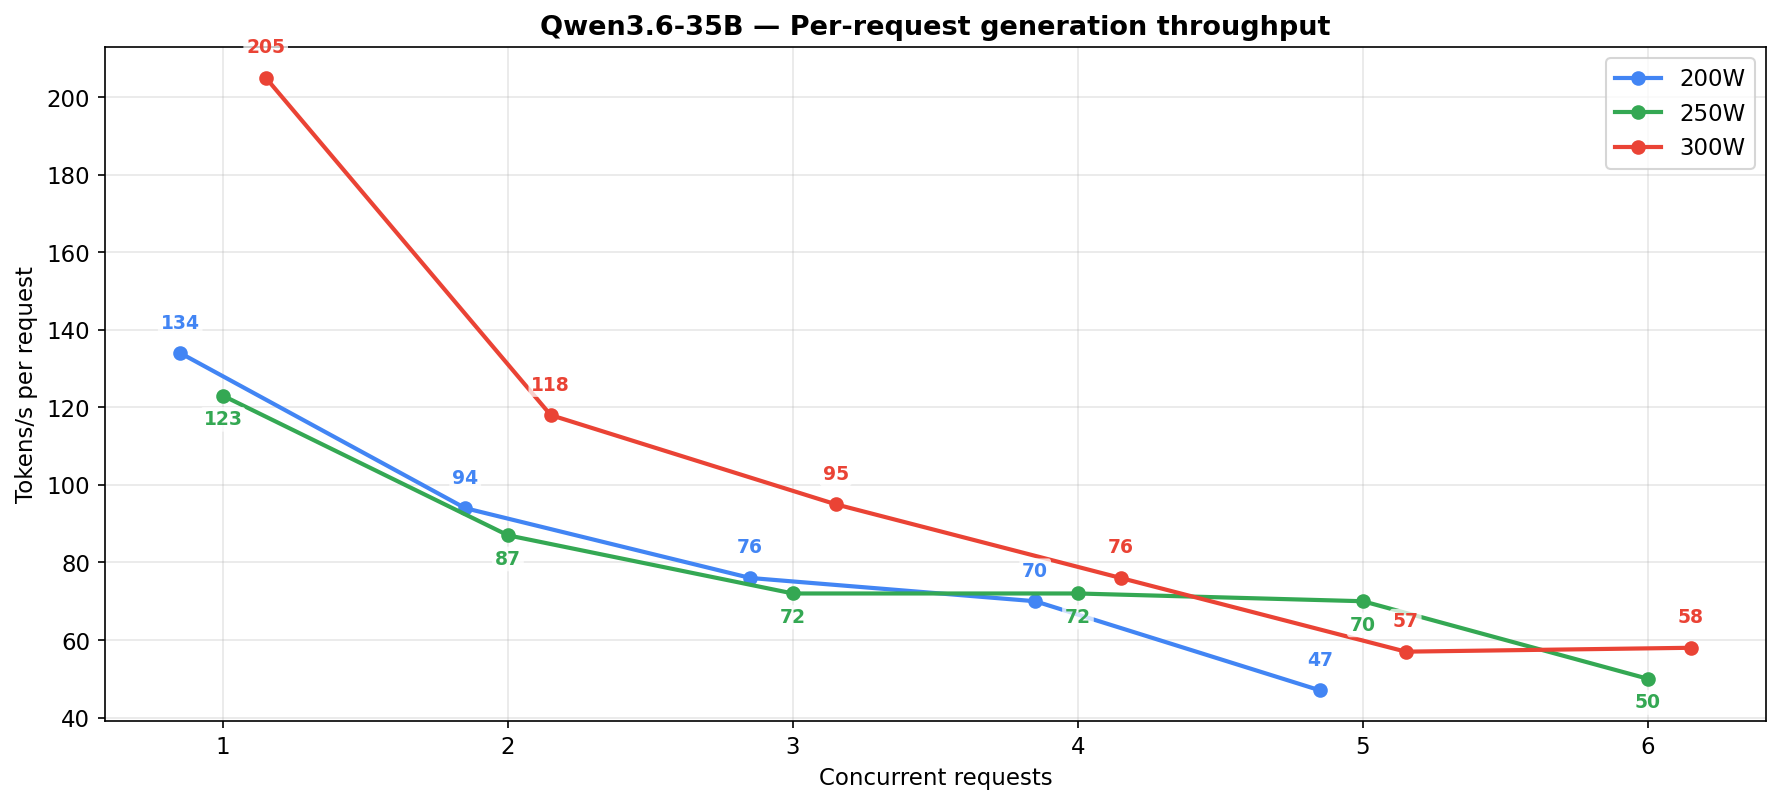
The per-request column shows the gap. At 5-6 concurrent at 250W the 3.6-35B holds 50-70 t/s per request, the 27B drops to 14-16.
Unlike the 3.5-35B and 3.5-122B which both fell into repetition loops on long agentic runs, the 3.6-35B and the 27B dense never did. The 3.6-35B has a different failure mode though: it would sometimes ignore requests entirely or not follow permissions correctly — not all tool calls that went through were what was actually asked for. The older models would retry too, but the 3.6-35B was noticeably more persistent about it. Probably the same trait that got the 3.5-35B stuck in loops, just better tuned toward problem solving this time around. It feels like a model trained for coding and coding alone: great at using tools, persistent at finishing work, does not care much about permissions and rules.
Worth noting my system is not a coding agent. It is an on-rails orchestrator where each subagent gets an exact set of tools that modify state in a database: turning on lights, searching emails, writing drafts, managing calendar, doing research, strategizing. A model tuned for coding may just not be aligned with that kind of structured tool use, where following permissions matters more than creative problem solving.
3.6-35B reliability
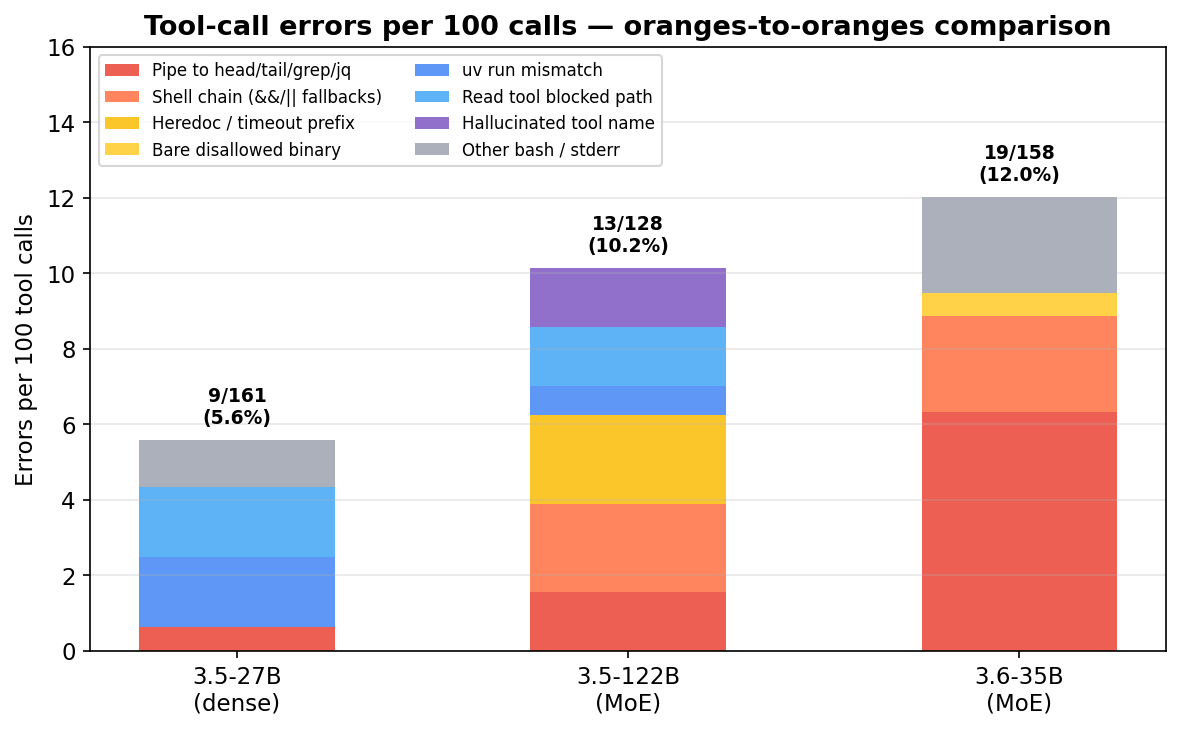
The speed comes at a cost. On an oranges-to-oranges comparison across ~20 sessions of identical workloads:
| Model | Sessions | Messages | Tool calls | Errors | Err/tool |
|---|---|---|---|---|---|
| qwen3.6-35b-a3b (MoE) | 20 | 145 | 158 | 19 | 12.0% |
| qwen3.5-27b (dense) | 21 | 138 | 161 | 9 | 5.6% |
| qwen3.5-122b (MoE) | 17 | 121 | 128 | 13 | 10.2% |
A note on how these numbers are comparable: the per-model tool-call counts (128-161) are subsampled from larger daily-use pools so the per-class breakdown below is directly comparable across models rather than skewed by different test-window lengths. The dense 27B’s pool was the largest (thousands of sessions accumulated from daily rotation, with an error rate averaging around 5.4% over that time), and I checked that the 161-call sample’s rate tracked the full-pool average — so the 5.6% here is a steady-state number, not a single-window artifact. The two MoE numbers came from dedicated test windows only, which makes the dense the sturdiest individual number in the three-way comparison.
Dense 27B makes about half the tool errors of either MoE variant (5.6% vs ~10-12%). The rate alone doesn’t tell the story — what matters is whether the model recovers when blocked.
Where the errors actually kill you
On a real ralf workflow (multi-stage research loop with a 3-call handshake: update-attempt-outcome → update-stage-status awaiting_eval → ralf_spawn step_evaluator) the 3.6-35B could not finish a single stage.
Both models hit the same wall: “how do I web search?” The 27B pivoted immediately to allowed scripts (fetch_context.py, embedding_search.py, context_cache.py, db_query.py), used real flags (--no-attach --agent, --sql, --command), completed the handshake, and advanced the loop. The 3.6-35B kept trying bash variants that got denied: ls scripts/ | grep -E "search|web", curl -s 'https://...', hallucinated flags (--no-agent instead of --no-attach --agent), hallucinated scripts (youtube_fetcher.py). It burned its turn budget on re-denied commands and never emitted the state transition that lets the ralf loop advance.
| Behavior | 3.6-35B | 27B |
|---|---|---|
| Reaction to permission denied | Retries bash variants, hallucinated scripts | Pivots to a different allowed script |
| Flag guessing | Invented --no-agent, --command search-videos | Used real flags (--no-attach --agent, --sql) |
| Ralf handshake completion | Often skipped update-attempt-outcome | Consistently emitted all 3 closing calls |
| Typical exit state | Attempt alive, no status transition, loop stuck | awaiting_eval set, evaluator spawned, loop advances |
The 27B later picked up the exact ralf instance that the 3.6-35B had stalled and finished it cleanly. The 3.6-35B does not give up on a blocked approach, but it also does not change strategy — the 27B does.
Failure-class breakdown
With the recovery story set, the aggregate numbers: errors per 100 tool calls by failure class.
| Failure class | 3.6-35B | 27B | 122B |
|---|---|---|---|
| Pipe to head / tail / grep / jq / sed | 6.33 | 0.62 | 1.56 |
| stderr redirect (2>&1 / 2>/dev/null) | 0.00 | 0.62 | 0.00 |
| Shell chain (&& / || fallbacks) | 2.53 | 0.00 | 2.34 |
| Heredoc (<<EOF) into uv run / python | 0.00 | 0.00 | 0.78 |
| timeout N uv run … prefix | 0.00 | 0.00 | 1.56 |
| Bare disallowed binary (ls, head, cat, find) | 0.63 | 0.00 | 0.00 |
| uv run python -c ”…“ | 0.00 | 0.62 | 0.00 |
| uv run of script not in allow list | 0.00 | 1.24 | 0.78 |
| Other bash (arg quoting, complex uv run) | 2.53 | 0.62 | 0.00 |
| Read tool with blocked path | 0.00 | 1.86 | 1.56 |
| Hallucinated tool name | 0.00 | 0.00 | 1.56 |
| Total | 12.03 | 5.59 | 10.16 |
Each model has a distinct failure signature:
- 3.6-35B: over half its errors are pipe-to-truncation slips (
| head,| tail,| grep,| jq) trying to cap output of an otherwise-allowed script. The rest spread across raw curl to external web APIs, barels/head,pkill ... || truechains,cd /path && uv run ...prefixes. - 27B: ~42% of its errors are the Read tool called with
/data/rendered/*.pngabsolute paths that the external_directories rule blocks. ~21% areuv runinvocations of plausibly-named scripts that are not on the allow list (food_management.py,data_query.py,thought_transfer.py). Only a handful of shell-chaining slips. - 122B:
timeout N uv run ...prefixes,cat << REPORT_EOF | uv run ... --value "$(cat)"heredoc composition,| jq '.attempt.session_id'for JSON extraction, and two cases of callingemit_guidancedirectly as a tool name instead of as a bash command.
Piping to head is reasonable in general, but not here: each script already returns exactly the size and scope of information the task needs, so truncating it would drop content the agent should have. Beyond that, the inability to follow clearly stated rules is a problem in its own right, especially for a system that controls real things.
Why the two MoEs break the rules in different ways and the dense 27B mostly does not is worth a post of its own. I wrote up the hypothesis separately — MoE routing: global rules lose to learned heuristics — where the short version is that routing caps reliability at a rough ceiling across MoE configs, and post-training only changes which kinds of errors you see, not how many.
The three-way comparison
None of this is synthetic. Every data point is from real OpenCode sessions doing real work. When the logs say 8 concurrent requests, that is 8 autonomous agents simultaneously calling tools, reading files, writing code. Initial prompts are 30-60k tokens depending on chat history and how much project context got loaded in. Most of it hits prefill-cache, but the rest is handled by the actual model.
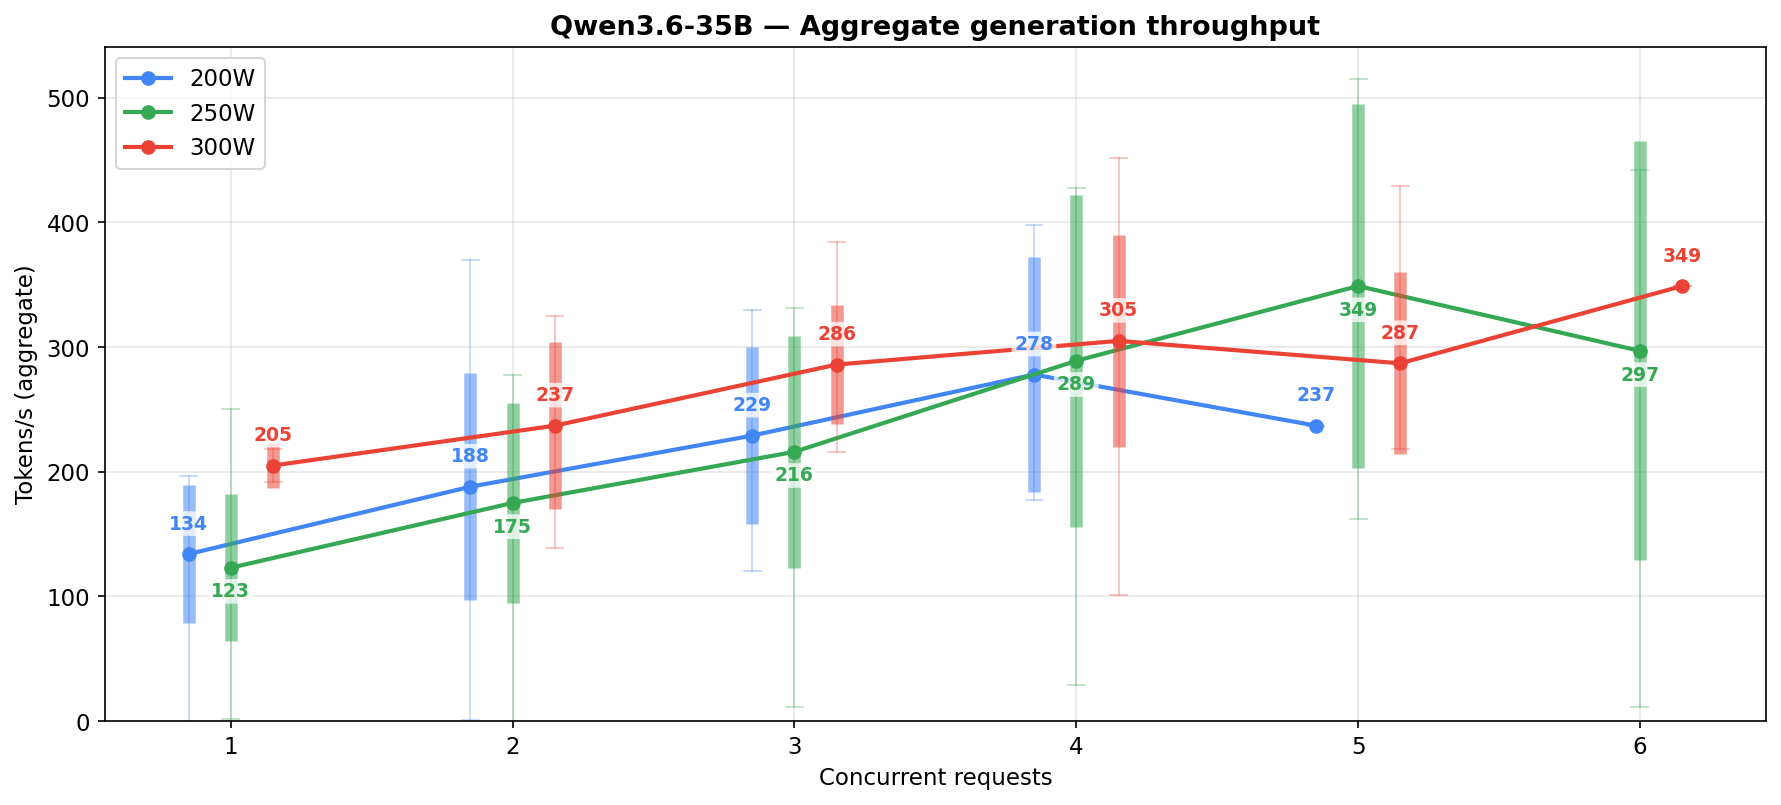
Generation throughput side-by-side
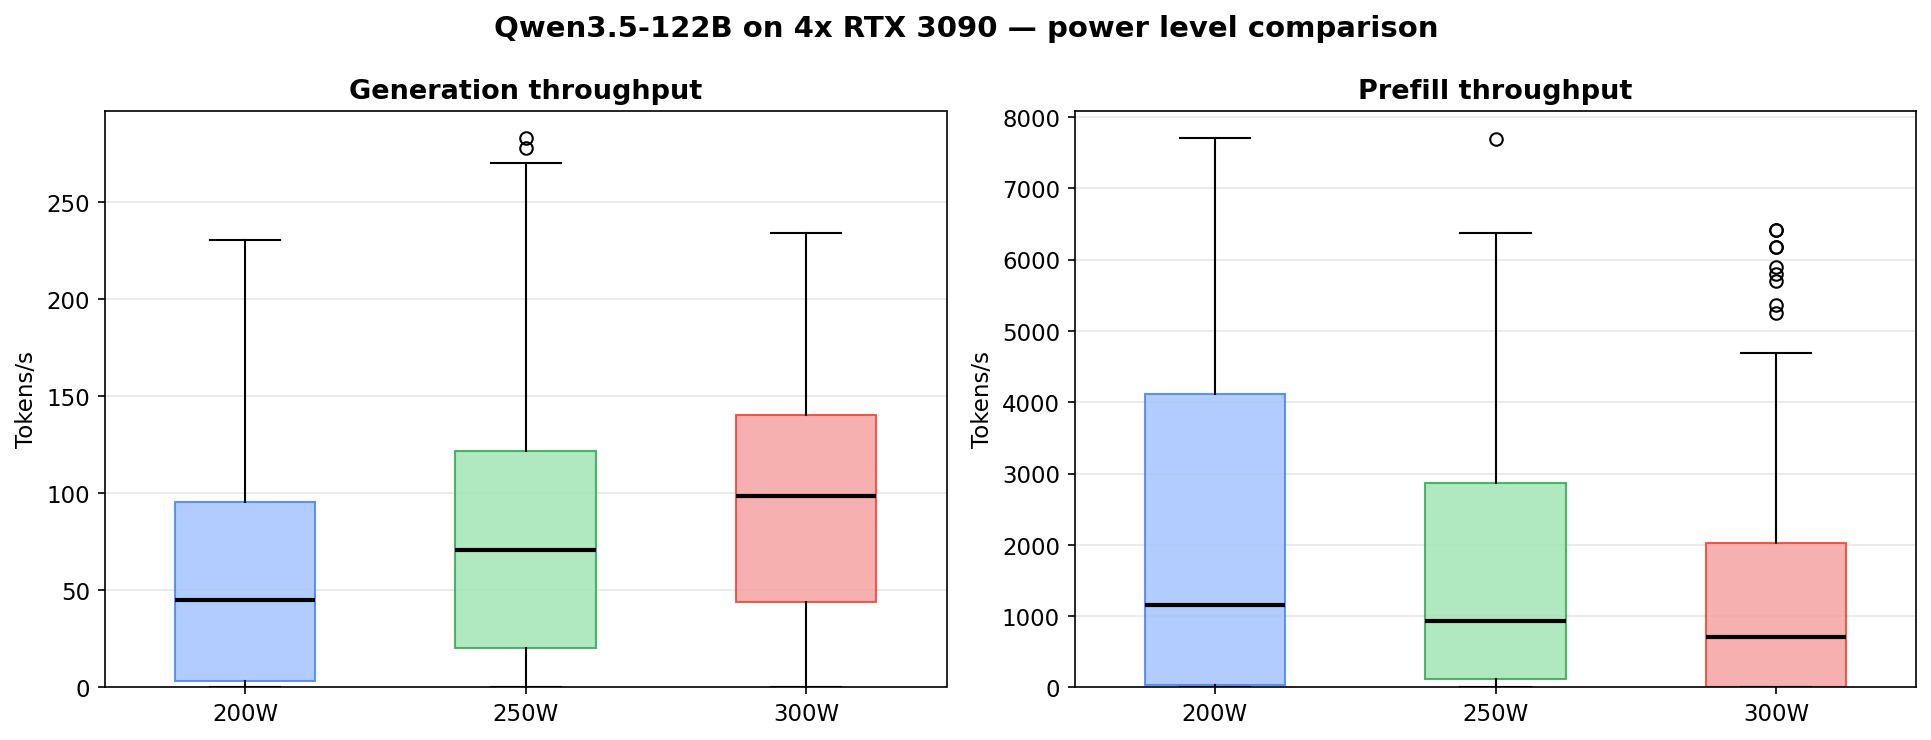
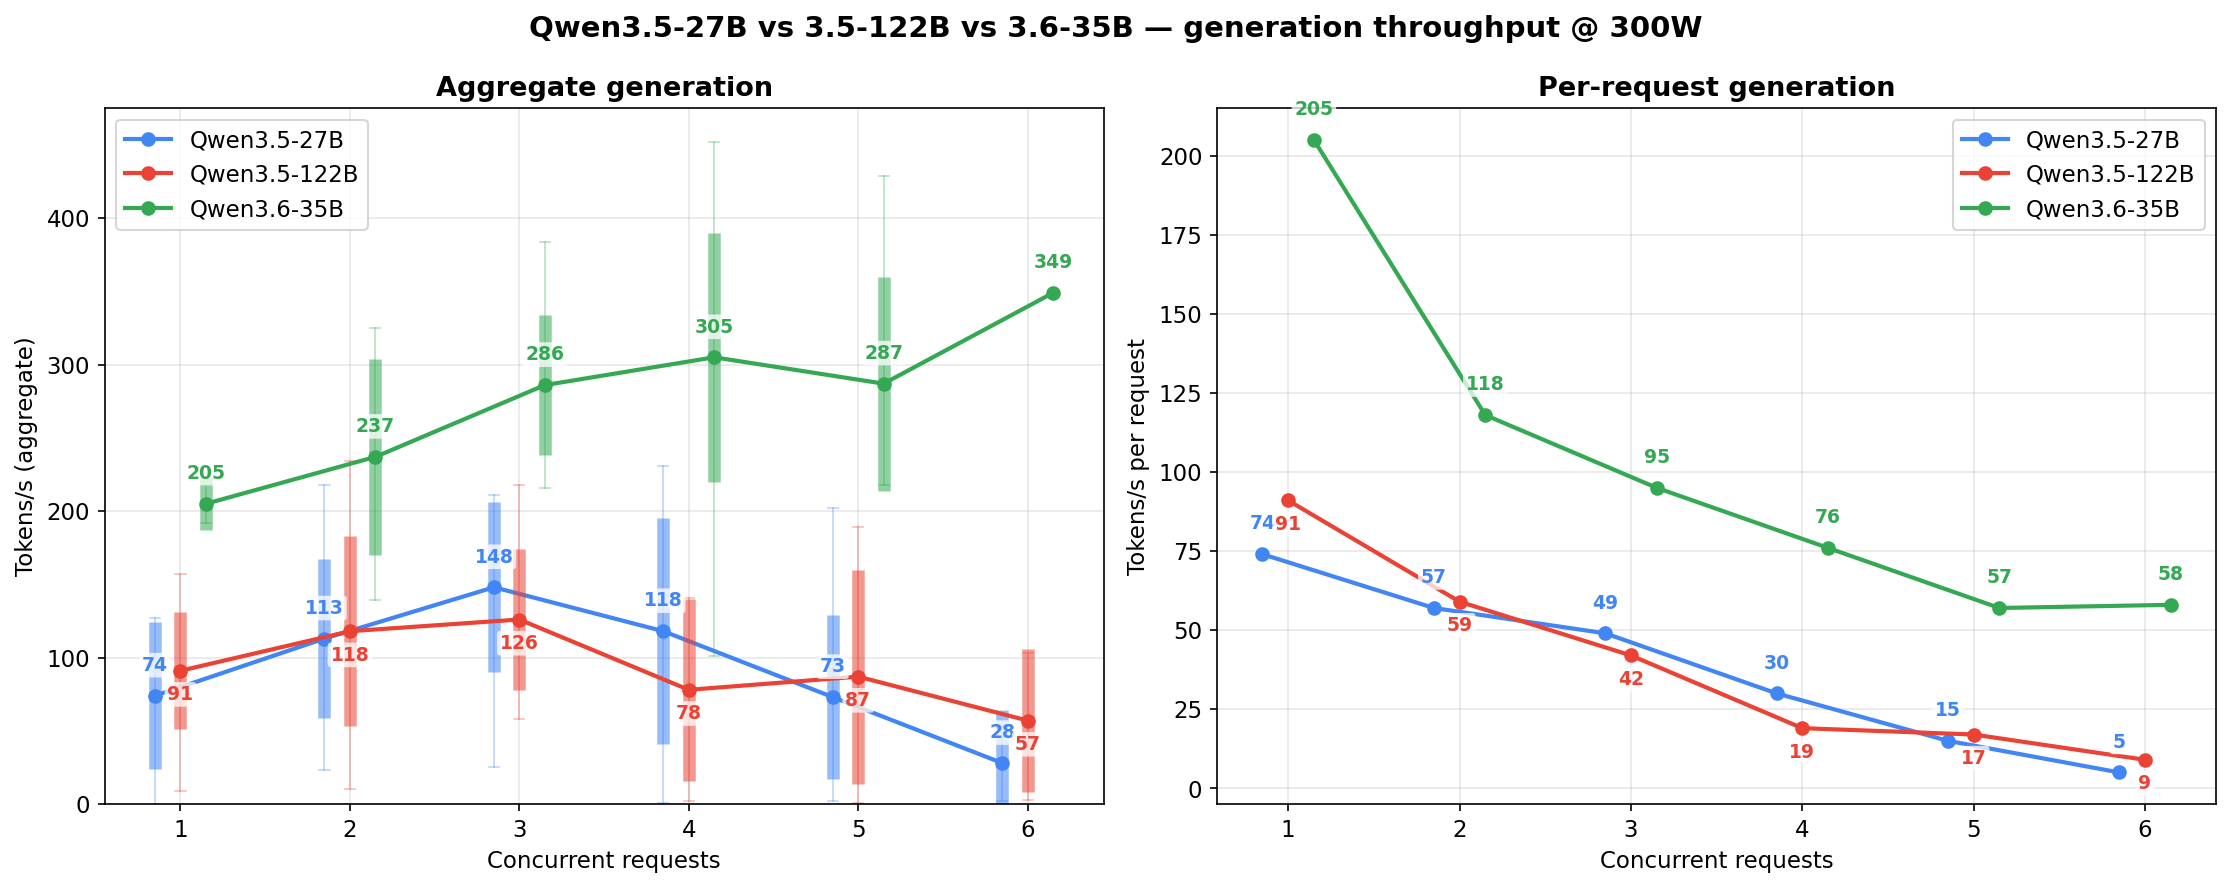
The per-model charts above each show one family across three power levels. This section flips the axis: one power level at a time, all three models stacked against each other. Candle bodies are ±1 std, wicks are min-to-max across the 10-second sample windows at each concurrency cell.
At 200W — the power-limited regime. The 27B holds its flat-ish shape; the 122B’s c=3-4 peak is the thin cells finding their spread; the 3.6-35B pulls ahead from c=2 onward and shows the widest wicks (MoE routing variance compounded by low power):
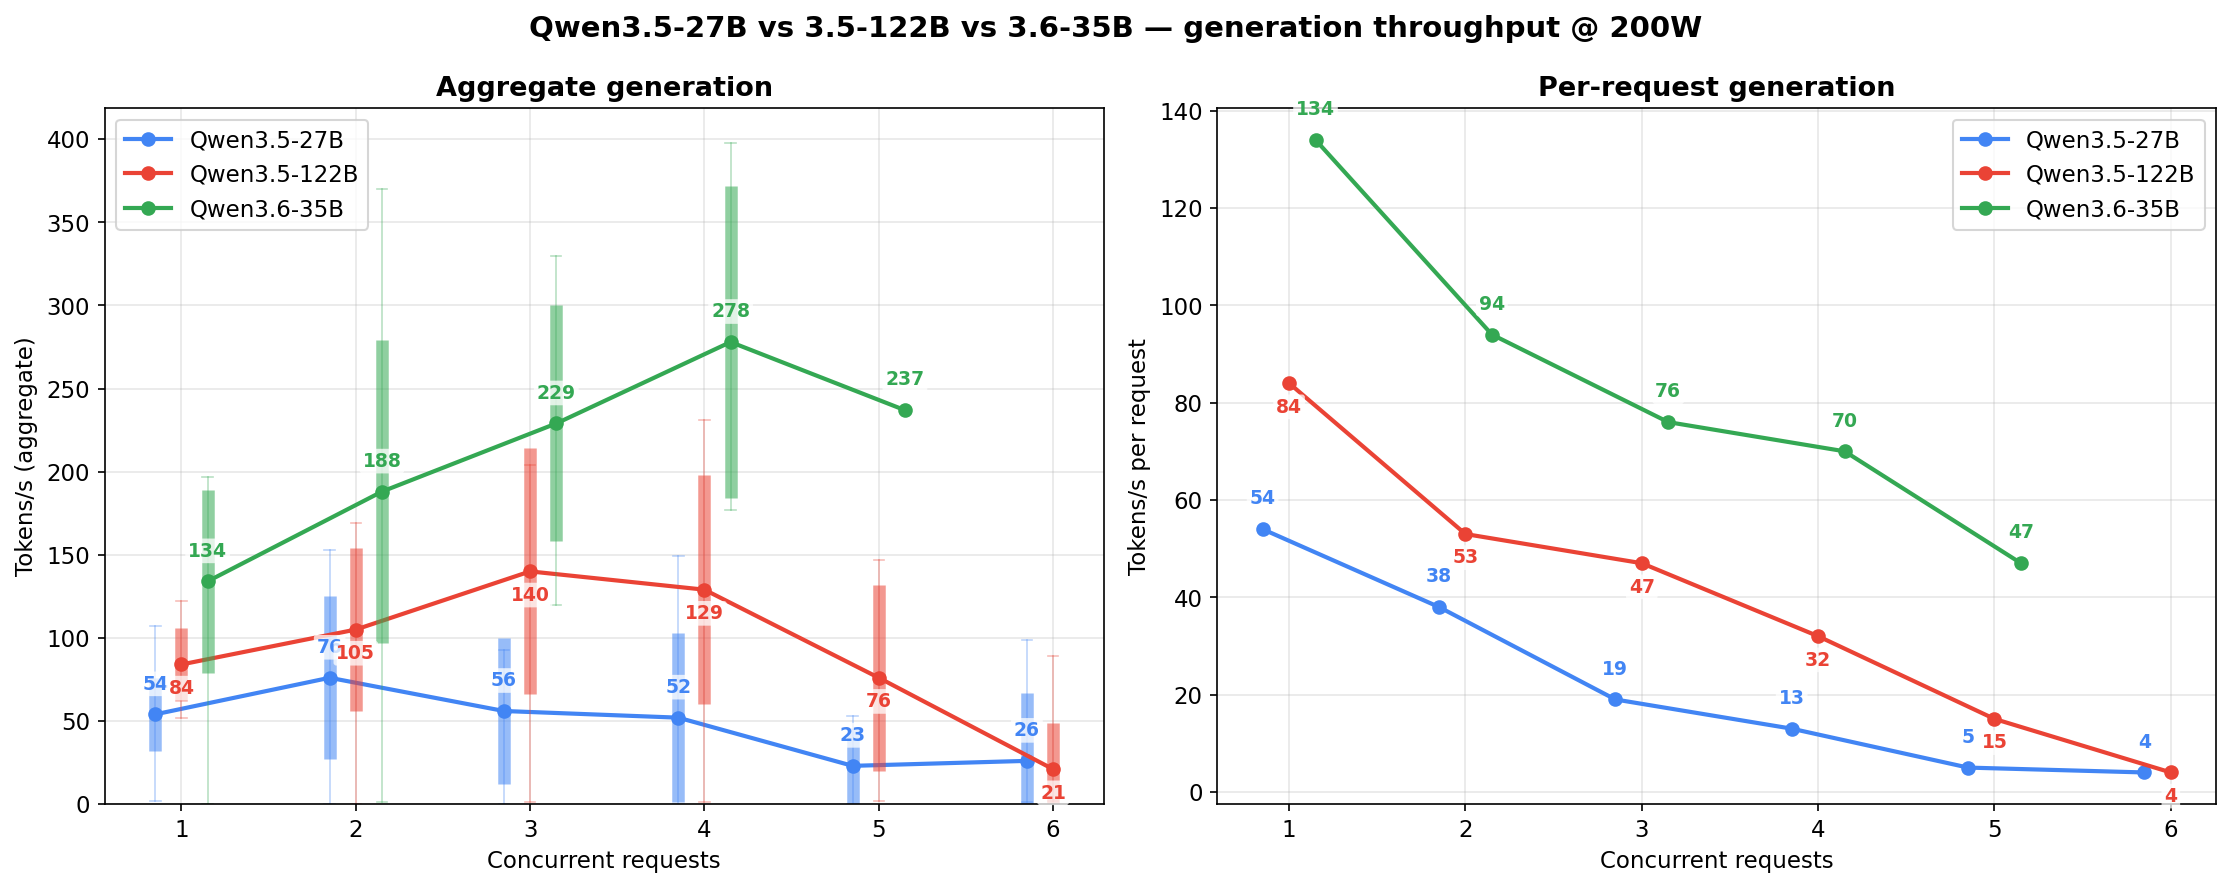
At 250W — the sweet spot. Per-request generation (right subplot) is where the 3.6-35B earns its “speed king” label: nearly 2x the per-agent throughput of the other two at c=1-3.
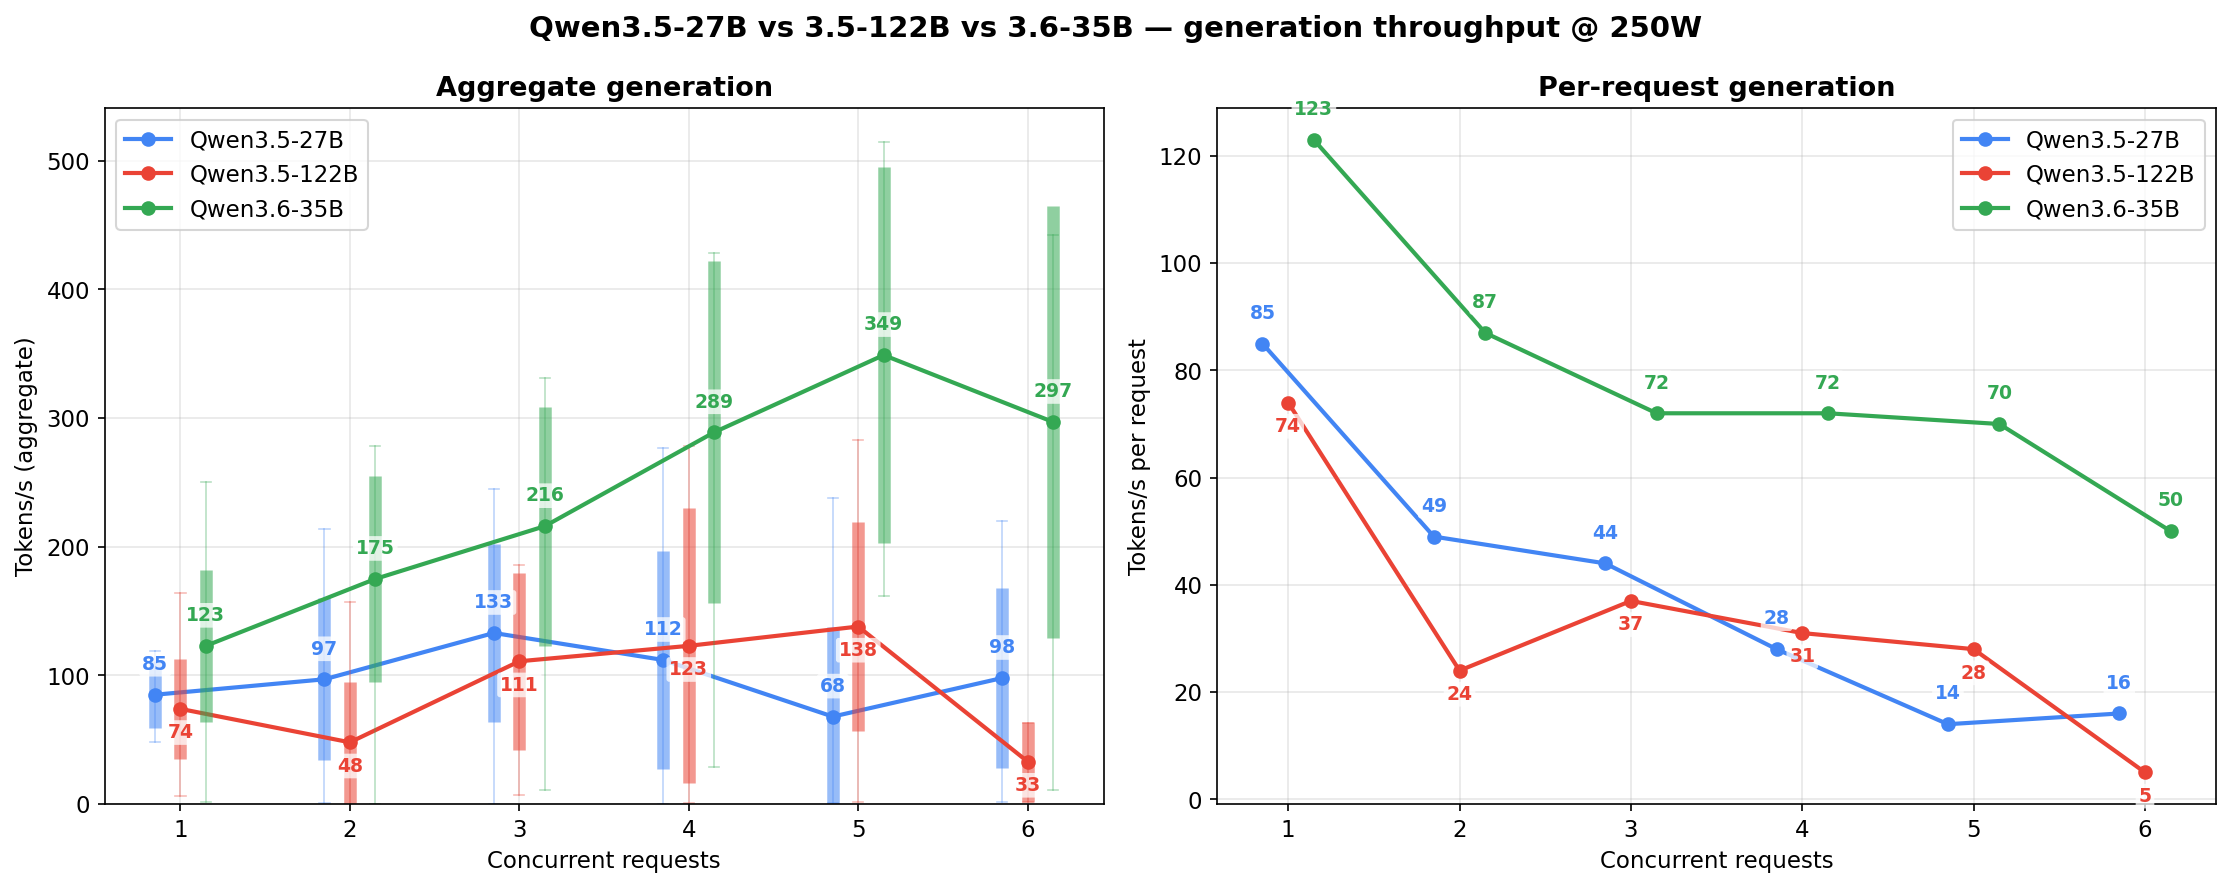
At 300W — the 3.6-35B scales noticeably, the 122B plateaus, the 27B already near its ceiling. The power-vs-throughput returns are asymmetric across models: the 3.6-35B is the only one that meaningfully rewards the 20% extra draw from 250W to 300W.
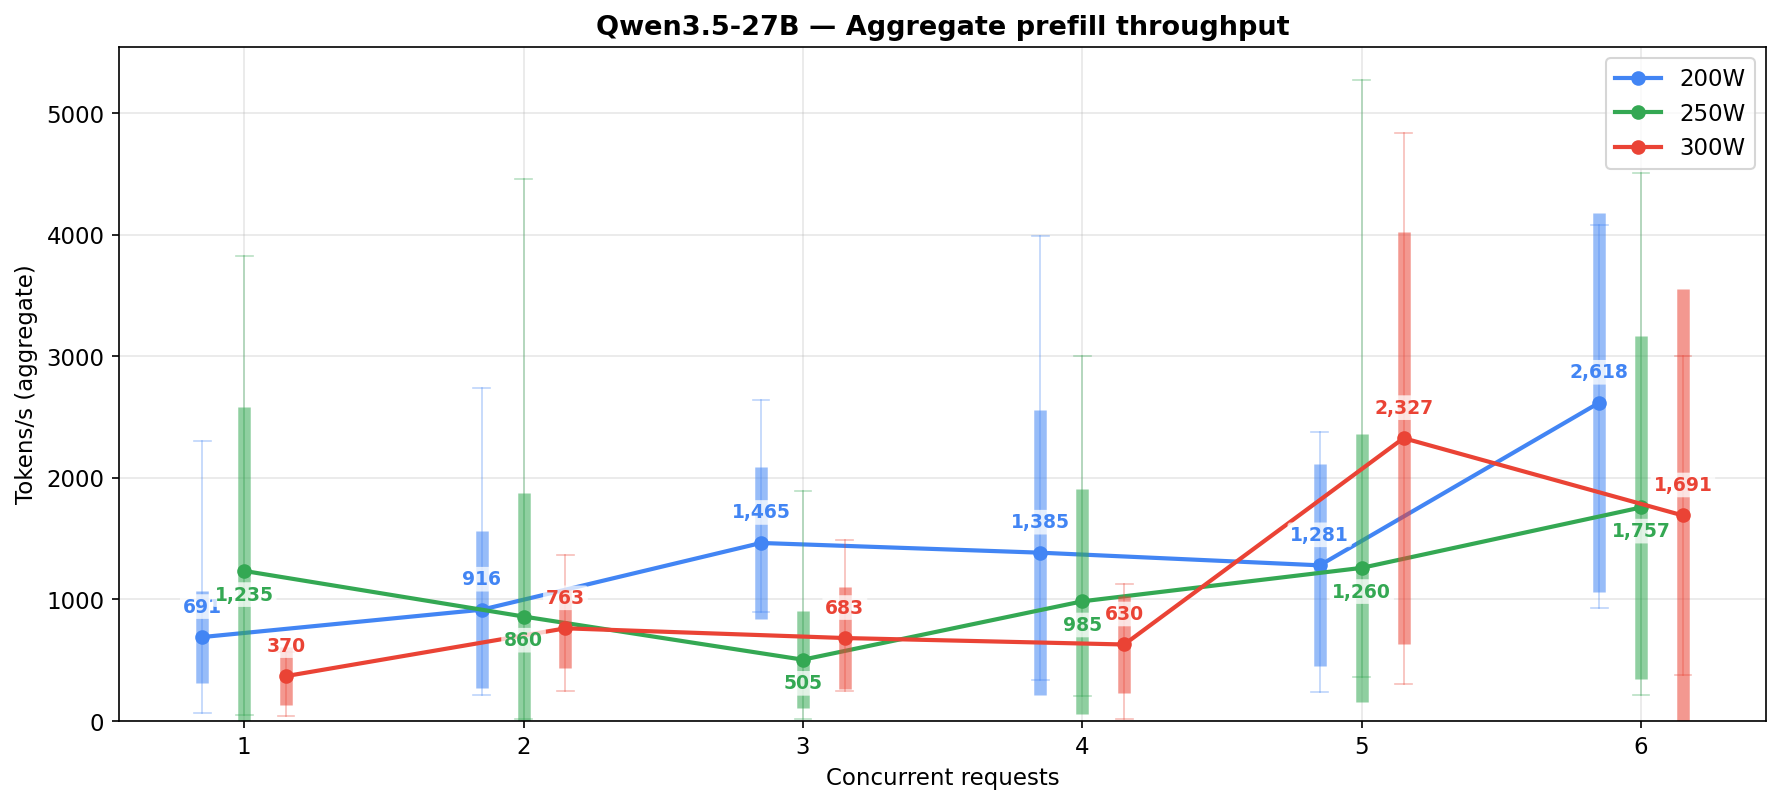
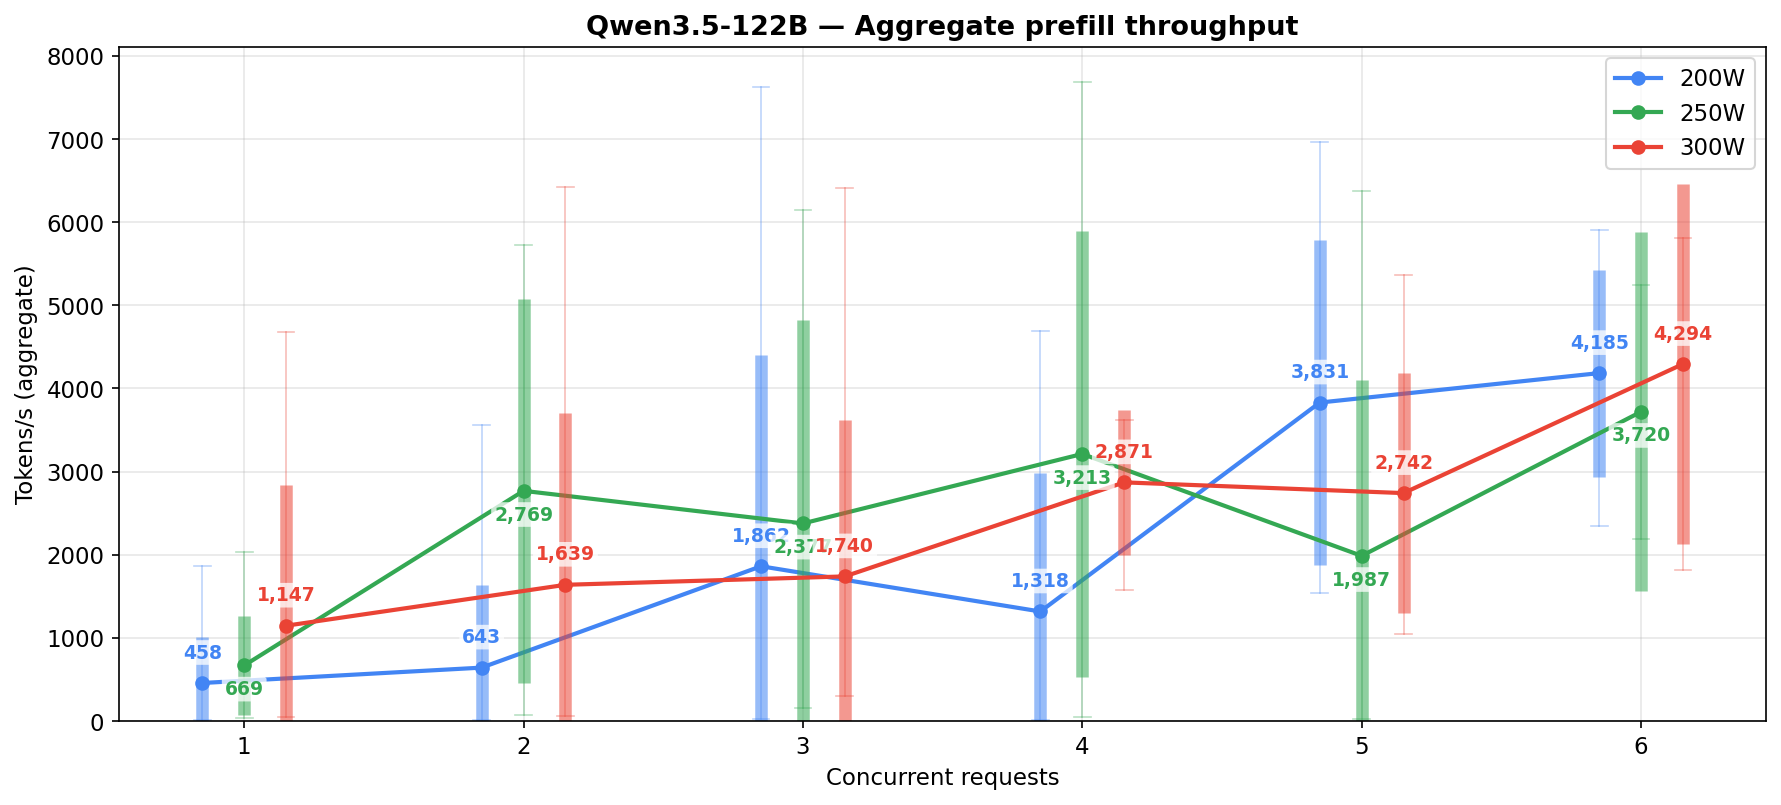
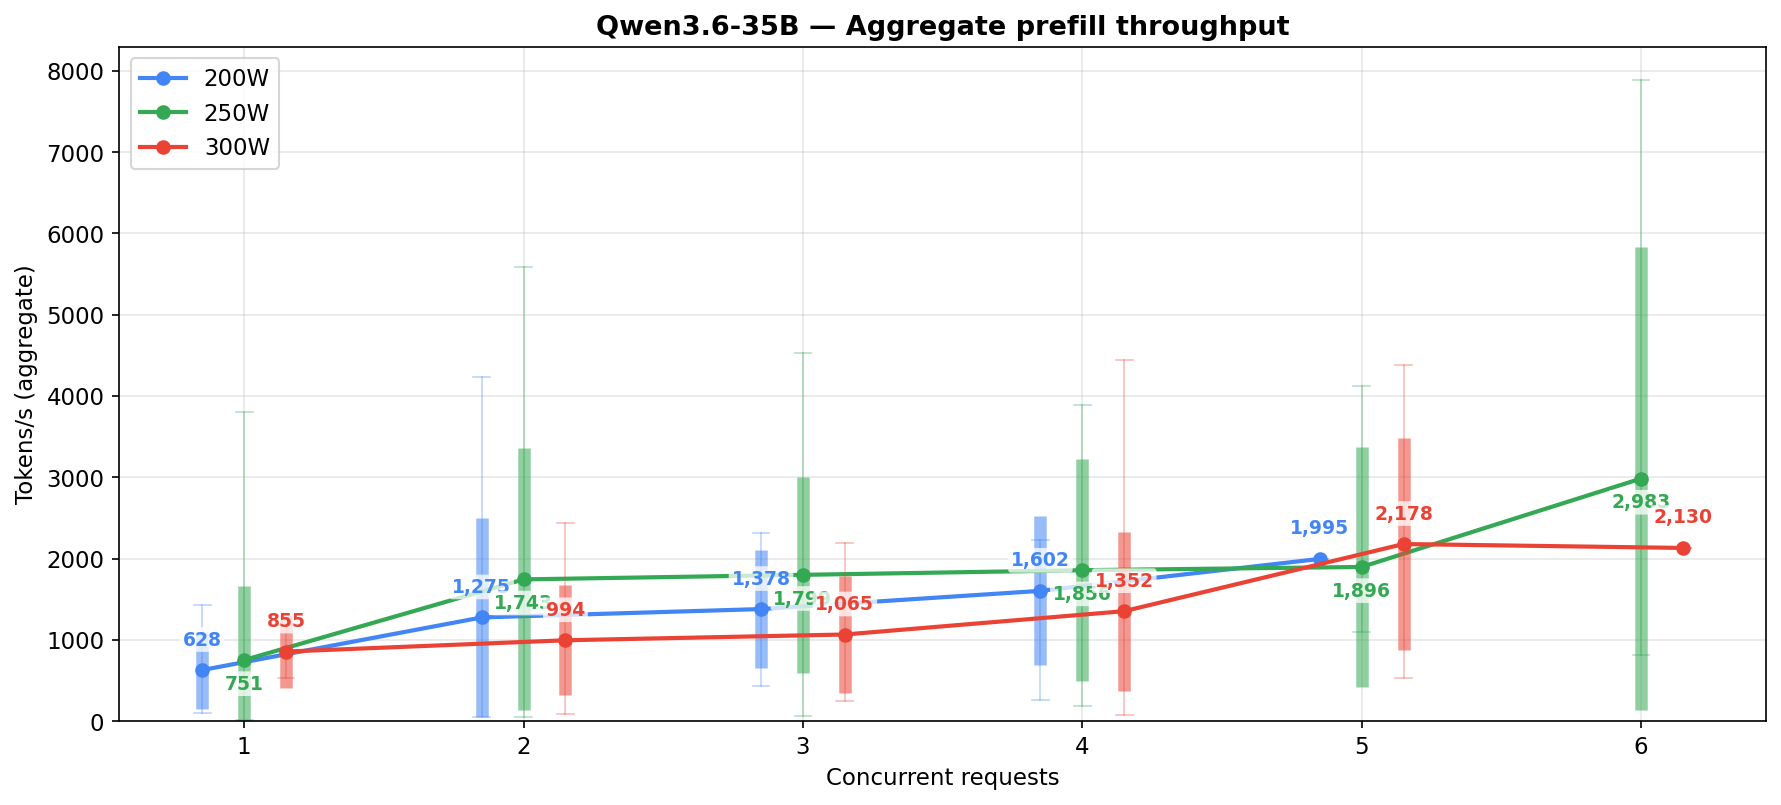
Prefill throughput by concurrency
Two versions of the same metric, depending on what question you’re asking. Both parse the same vLLM logs at 250W; both bucket samples by the Running count in each 10-second window.
Sustained prefill throughput — averages all windows at each concurrency level, including the ones where the engine spent the window purely generating (prefill=0) or idle between bursts. This is closer to what an agent pipeline actually experiences when it spends a lot of time not prefilling because the prefix cache is handling most of the prompt.
| Concurrent reqs | Qwen3.5-27B (n) | Qwen3.5-122B (n) | Qwen3.6-35B (n) |
|---|---|---|---|
| 1 | 926 (8) | 573 (21) | 626 (90) |
| 2 | 553 (28) | 2343 (13) | 1589 (34) |
| 3 | 364 (36) | 1849 (9) | 1799 (16) |
| 4 | 726 (19) | 2499 (9) | 1856 (8) |
| 5 | 1001 (34) | 1754 (17) | 1896 (4) |
| 6 | 1427 (16) | 2480 (3) | 2983 (5) |
Aggregate sustained at 250W across c=1-6: 27B ~756, 122B ~1651, 3.6-35B ~1124 t/s.
Active-only prefill throughput — excludes every window where prefill=0 from the average, so each cell only reflects windows during which the engine was actually processing a prompt. Closer to a conventional benchmark number: “when this model is prefilling, how fast does it go?” Note n is smaller (only windows with prefill>0) and varies per cell, so sample counts here don’t line up with the generation tables.
| Concurrent reqs | Qwen3.5-27B (n) | Qwen3.5-122B (n) | Qwen3.6-35B (n) |
|---|---|---|---|
| 1 | 1235 (6) | 669 (18) | 751 (75) |
| 2 | 860 (18) | 2769 (11) | 1743 (31) |
| 3 | 505 (26) | 2377 (7) | 1799 (16) |
| 4 | 985 (14) | 3213 (7) | 1856 (8) |
| 5 | 1260 (27) | 1987 (15) | 1896 (4) |
| 6 | 1757 (13) | 3720 (2) | 2983 (5) |
Aggregate active-only at 250W across c=1-6: 27B ~1025, 122B ~2155, 3.6-35B ~1124 t/s. These match the per-power-level aggregates elsewhere in the post — those tables use the active-only methodology throughout.
Practical reading: the 122B wins on both views at most concurrency levels, but the gap closes on the sustained view. If the question is “what is this model capable of”, the active-only numbers are the right lens. If the question is “what will my agent stack actually see”, the sustained numbers are.
Time to first token
Prefill speed is the single most operationally important fact in this whole post for anyone designing agent loops. With 30-60k token initial prompts, the 27B at ~1000 t/s prefill means 30-60 seconds before first output. The 122B at 2000-3000 t/s cuts that in half — 15-30 seconds. On paper the 122B wins here.
Prefix caching eats most of the apparent gap in practice, though. In the 150-subagent orchestrator, most of the 30-60k tokens on any given turn are system prompt + tool descriptions + recent scratchpad — all of which hit the prefix cache. Only the tail (new tool output + new user turn) actually needs fresh prefill. So the difference between 1000 t/s and 2000-3000 t/s is only meaningful on the uncached tail, which is usually a few thousand tokens. At that size, both models are fast enough that the wall time is dominated by generation (reasoning tokens, tool-call emission) rather than prefill.
What the 122B’s prefill advantage doesn’t rescue is that a fast prefill followed by a garbled tool call is wasted work. If the 122B returns a command that the allow-list denies, the whole prefill-plus-generation cycle happens again on the retry, and the denied call also counts against your per-session error budget. “Twice as fast on prefill” is not twice as fast in a reliability-bound workload.
The streaming angle is real if you’re running an agent where a human reads output in real time. On a fully autonomous loop, first-token latency matters less than completion latency, and completion latency is where the 3.6-35B’s generation speed shows up.
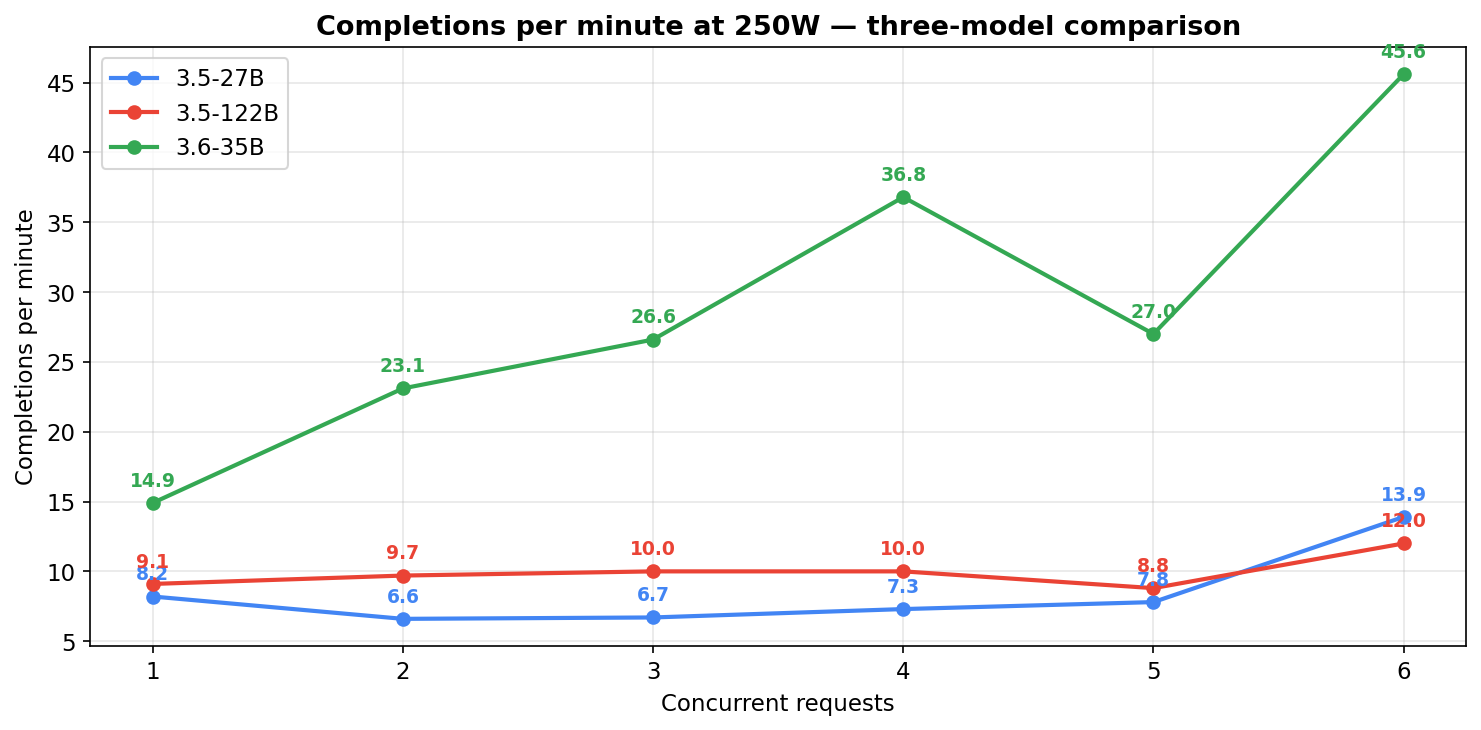
Completions per minute
Token-per-second throughput is one lens. For agent workloads, the more intuitive question is: how many actual tasks finish per minute at each concurrency level? Computed by tallying POST /v1/chat/completions HTTP/1.1" 200 log lines per 10-second window and bucketing by the concurrency at that window. Mixed-task metric (short and long responses both count as 1 completion), so this is functional throughput under the organic task mix rather than per-task latency.
Completions per minute at 250W (the workload driver):
| Concurrent reqs | Qwen3.5-27B | Qwen3.5-122B | Qwen3.6-35B |
|---|---|---|---|
| 1 | 8.2/min | 9.1/min | 14.9/min |
| 2 | 6.6/min | 9.7/min | 23.1/min |
| 3 | 6.7/min | 10.0/min | 26.6/min |
| 4 | 7.3/min | 10.0/min | 36.8/min |
| 5 | 7.8/min | 8.8/min | 27.0/min |
| 6 | 13.9/min | 12.0/min | 45.6/min |
Before walking the numbers, one caveat about aggregating. Each model’s overall average is dominated by how much time it spent at different concurrencies, not by a shared baseline — the 27B runs as daily driver and accumulates hours at typical working concurrencies; the 122B had shorter dedicated test windows; the 3.6-35B had heavy 250W c=1 sampling from its own daily rotation. So if you took each model’s single “average req/min” across everything it was measured on and put those numbers side by side, you’d be comparing models on three different workload mixes, not on the same one. The right comparison is column by column — 27B at c=4 vs 122B at c=4 vs 3.6-35B at c=4 — where each cell is the same concurrency state. Row-by-row works too (same model across power levels). A single aggregate number per model is misleading unless the sample distributions happen to match, and in live-workload data they don’t.
Three shape observations from the 250W table:
- 3.6-35B finishes 2-4x more requests per minute than either sibling across most concurrency levels (gap is smallest at c=1 — about 1.6-1.8x — biggest around c=4 at ~4-5x). Matches the raw generation speed advantage and translates it into actual work-done.
- The 27B holds a flat ~7/min across c=1-5 — slow-but-steady. Total work-done stays roughly constant whether you run 2 or 5 agents in parallel; per-request throughput drops, but completions absorb the additional concurrency.
- The 122B saturates around 9-10/min from c=2 onward. Adding parallelism past 2 doesn’t help it finish more work — requests just queue up and share the same effective compute.
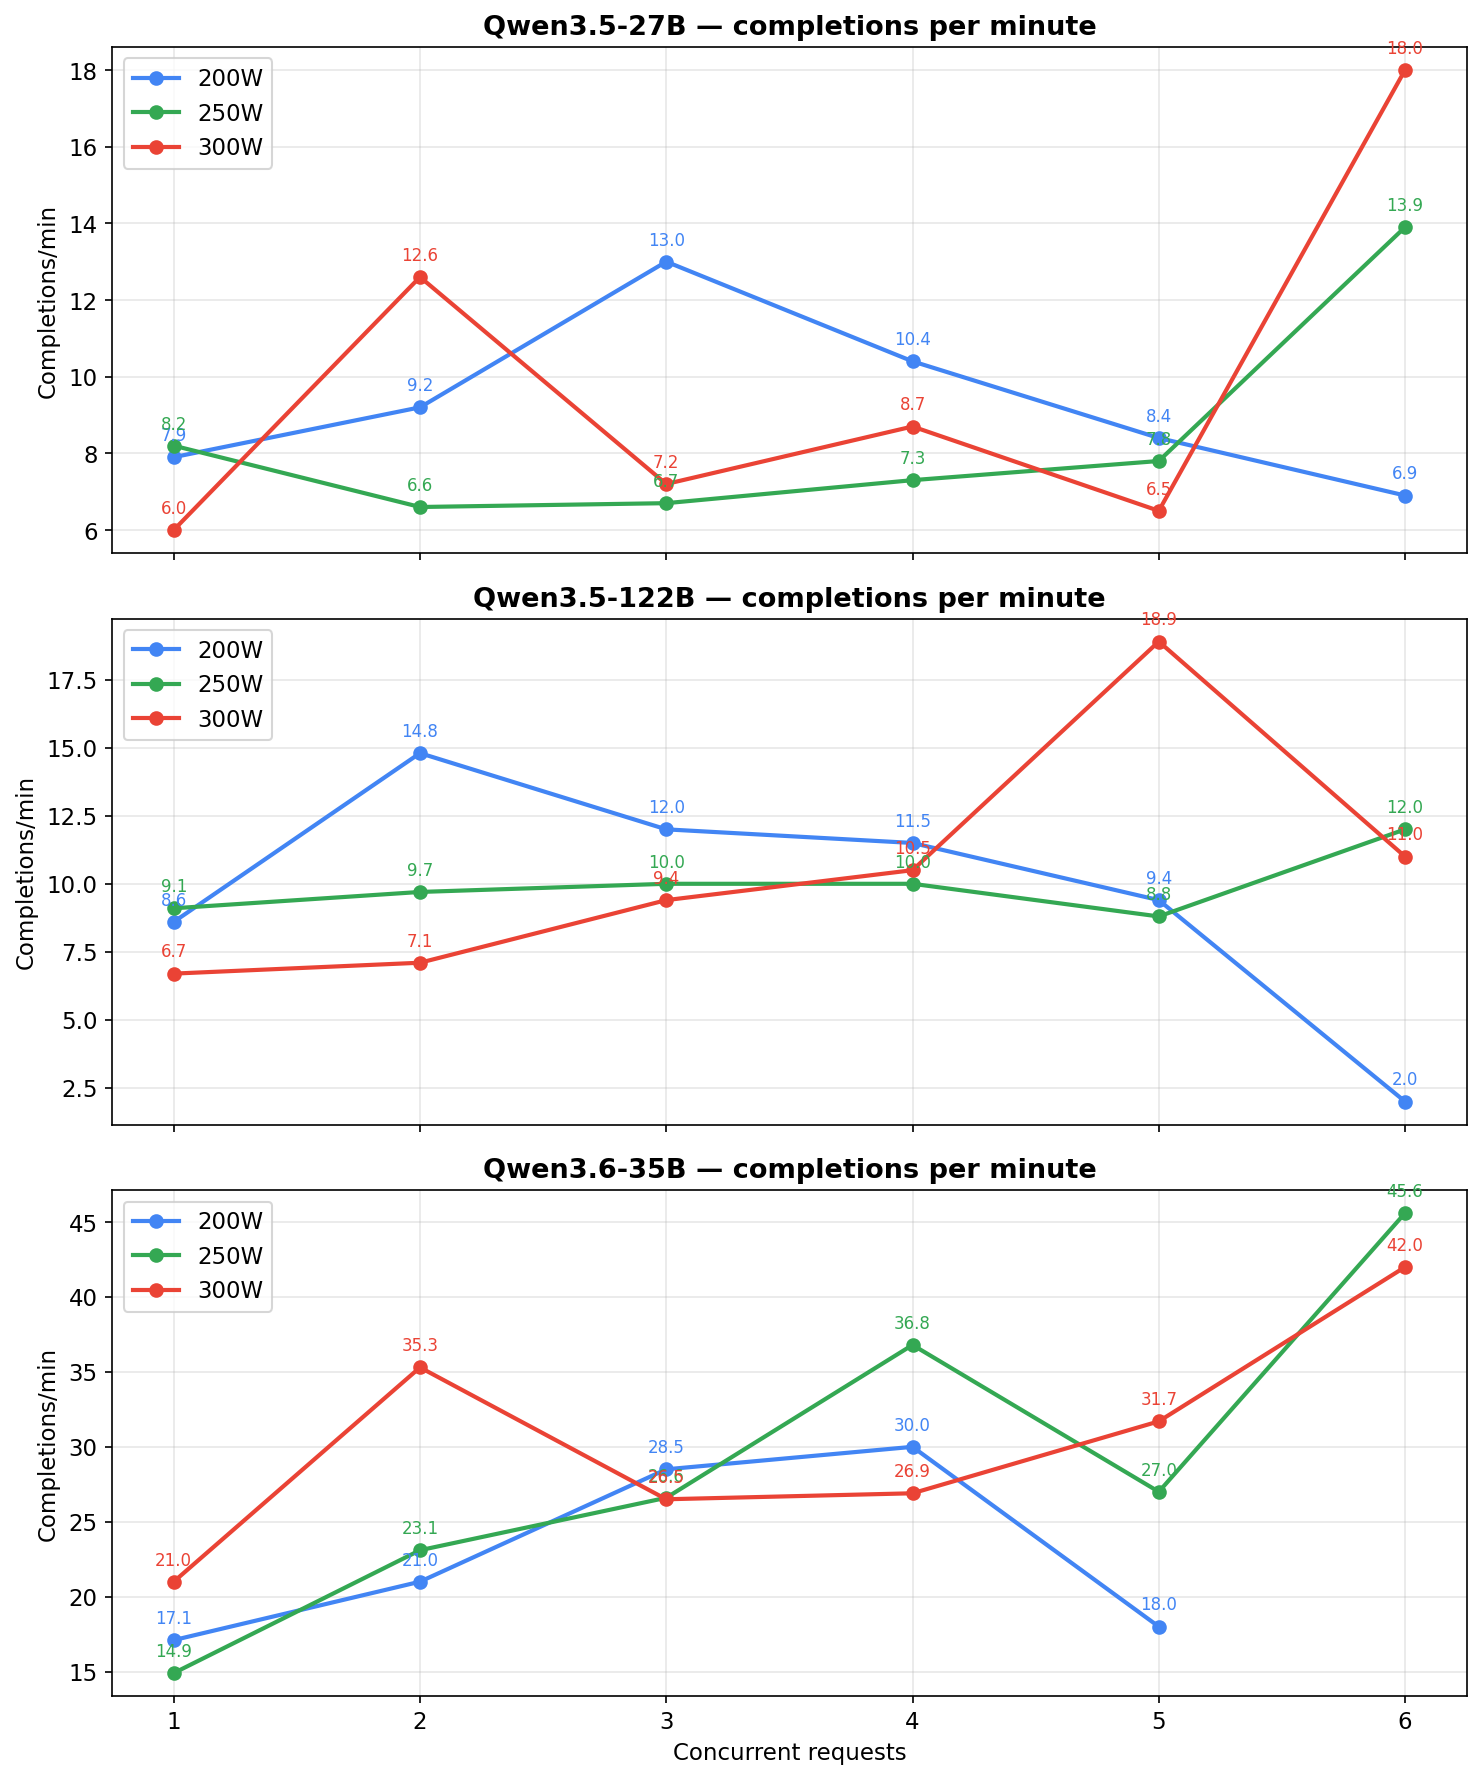
Same metric broken down by power level (all three power pins, all three models):
| Concurrent | 27B 200W | 27B 250W | 27B 300W | 122B 200W | 122B 250W | 122B 300W | 3.6-35B 200W | 3.6-35B 250W | 3.6-35B 300W |
|---|---|---|---|---|---|---|---|---|---|
| 1 | 7.9 | 8.2 | 6.0 | 8.6 | 9.1 | 6.7 | 17.1 | 14.9 | 21.0 |
| 2 | 9.2 | 6.6 | 12.6 | 14.8 | 9.7 | 7.1 | 21.0 | 23.1 | 35.3 |
| 3 | 13.0 | 6.7 | 7.2 | 12.0 | 10.0 | 9.4 | 28.5 | 26.6 | 26.5 |
| 4 | 10.4 | 7.3 | 8.7 | 11.5 | 10.0 | 10.5 | 30.0 | 36.8 | 26.9 |
| 5 | 8.4 | 7.8 | 6.5 | 9.4 | 8.8 | 18.9 | 18.0 | 27.0 | 31.7 |
| 6 | 6.9 | 13.9 | 18.0 | 2.0 | 12.0 | 11.0 | — | 45.6 | 42.0 |
All values are completions per minute. Cells with n ≤ 5 windows (rare-workload combinations) are still shown but read them as directional. The blank at 3.6-35B / 200W / c=6 is genuine — the 200W measurement window rarely saw 6 requests simultaneously in flight for the 3.6-35B, so there were no windows at that cell to average.
Tokens per watt
4 GPUs at each power level means 800W / 1000W / 1200W across the tensor-parallel group. These are GPU-only numbers, add 150-250W for CPU, RAM, NVMe, PSU overhead.
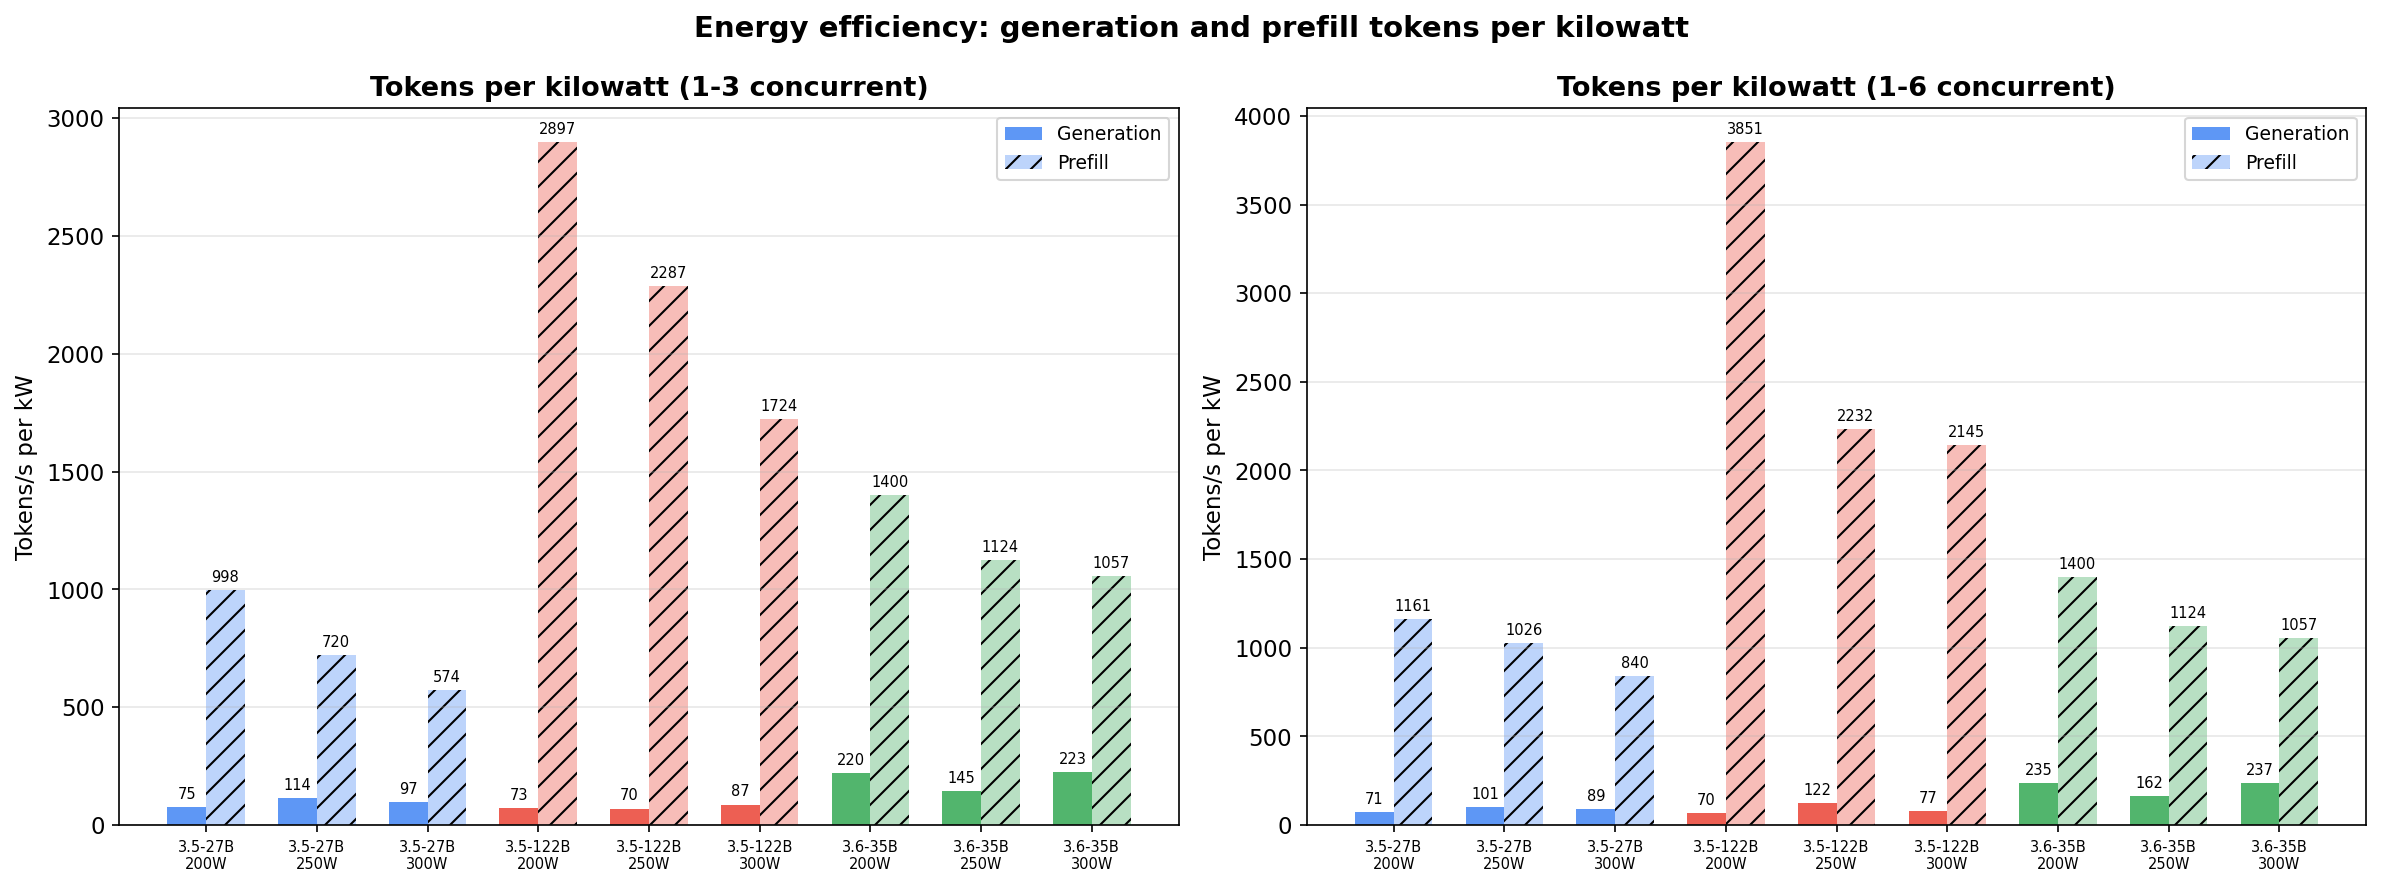
At 1-3 concurrent (typical agentic load):
| Model | Power | Avg Gen t/s | Gen t/kW | Avg Prefill t/s | Prefill t/kW |
|---|---|---|---|---|---|
| 27B | 200W | 60 | 75 | 798 | 998 |
| 27B | 250W | 114 | 114 | 720 | 720 |
| 27B | 300W | 116 | 97 | 689 | 574 |
| 122B | 200W | 59 | 73 | 2317 | 2897 |
| 122B | 250W | 70 | 70 | 2287 | 2287 |
| 122B | 300W | 105 | 87 | 2068 | 1724 |
| 3.6-35B | 200W | 176 | 220 | 1120 | 1400 |
| 3.6-35B | 250W | 145 | 145 | 1124 | 1124 |
| 3.6-35B | 300W | 267 | 223 | 1268 | 1057 |
At 1-6 concurrent (heavier parallel load):
| Model | Power | Avg Gen t/s | Gen t/kW | Avg Prefill t/s | Prefill t/kW |
|---|---|---|---|---|---|
| 27B | 200W | 57 | 71 | 929 | 1161 |
| 27B | 250W | 101 | 101 | 1026 | 1026 |
| 27B | 300W | 107 | 89 | 1008 | 840 |
| 122B | 200W | 56 | 70 | 3081 | 3851 |
| 122B | 250W | 122 | 122 | 2232 | 2232 |
| 122B | 300W | 92 | 77 | 2573 | 2145 |
| 3.6-35B | 200W | 188 | 235 | 1120 | 1400 |
| 3.6-35B | 250W | 162 | 162 | 1124 | 1124 |
| 3.6-35B | 300W | 284 | 237 | 1268 | 1057 |
The 3.6-35B dominates generation efficiency — nearly double the 27B’s gen tokens/kW at 200W and still far ahead at 300W. Prefill efficiency sits between the other two.
The 122B still wins prefill per watt. The 27B still has the lowest error rate. The 3.6-35B generates the most tokens per watt but wastes more of them on failed tool calls.
Related discussion
A shortened version of this writeup was posted to r/LocalLLaMA and drew useful comments, particularly on KV-cache behaviour, MTP vs memory pressure, and how the three models compare at higher quantisation levels than the ones tested here: Qwen3.5-27B, Qwen3.5-122B, and Qwen3.6-35B on 4x RTX 3090 — MoEs struggle with strict global rules.
Potential improvements (surfaced from the Reddit discussion)
One avenue I haven’t tested yet, pointed out by u/Opteron67 in the Reddit thread: aikitoria/open-gpu-kernel-modules — a modified NVIDIA kernel driver (derived from tinygrad’s 4090 work) that enables reliable PCIe P2P communication between consumer GPUs. NVLink P2P between paired 3090s works out of the box, but PCIe P2P between non-NVLinked cards isn’t officially supported by NVIDIA’s stock driver on consumer cards — which matters for my mixed topology.
Every config in this post uses --disable-custom-all-reduce because vLLM’s custom all-reduce kernel hangs on the mixed 2×NVLinked + 2×PCI topology — without reliable P2P the kernel can’t negotiate the ring correctly. Falling back to NCCL’s standard all-reduce path works, but it’s probably slower than custom all-reduce, especially for tensor-parallel operations and MoE’s expert-parallel communication.